What LoadLitmus Is
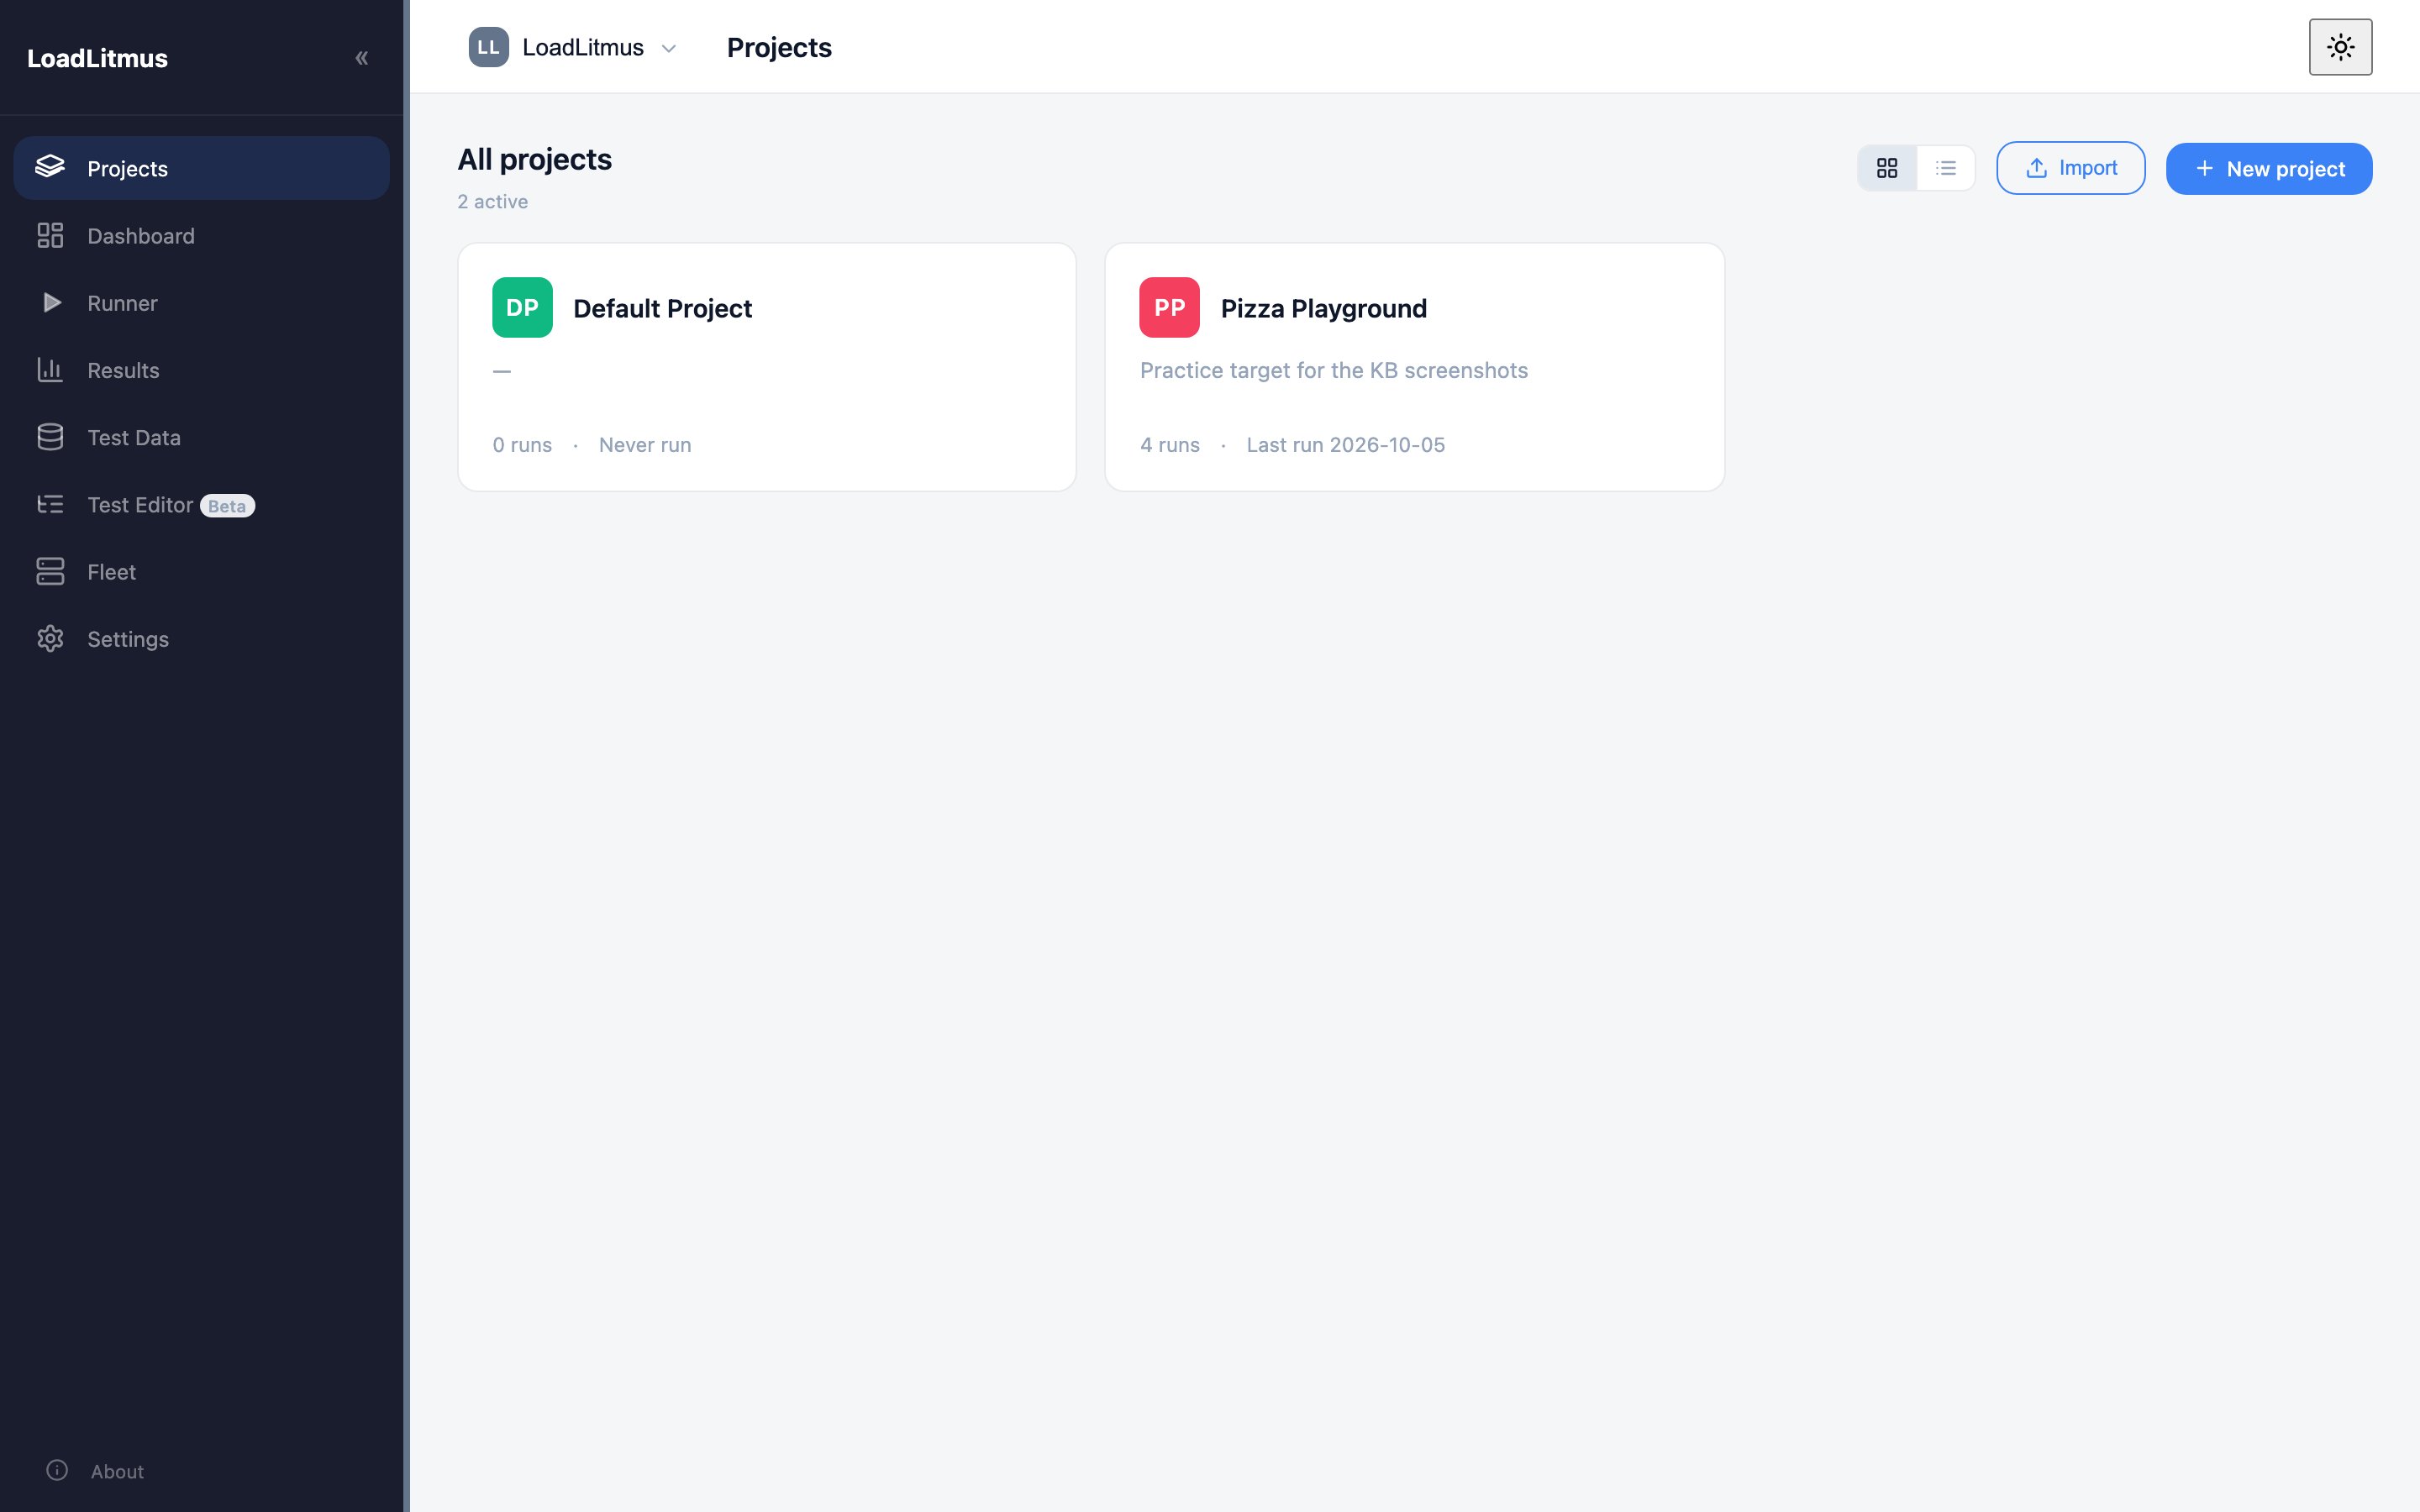
Running a JMeter test by hand means a long command line, a JTL file somewhere, a report you generate afterwards, and a folder of results only you can find. LoadLitmus puts all of that behind a web page, one per project, so a run is repeatable by anyone on the team and every past run is still there next week.
Why
Without a dashboard, a real engagement drifts into these problems:
- The exact command that produced last week's numbers is in someone's shell history.
- Results live in
C:/Users/<someone>/Desktop/PROD/, on one laptop. - Only the person who wrote the script knows which
-Jflags to pass. - Nobody can watch the test except the person running it.
LoadLitmus fixes those by keeping the plan, the data, the parameters and the results together in a project folder, and by exposing the run itself in a browser.
What it does
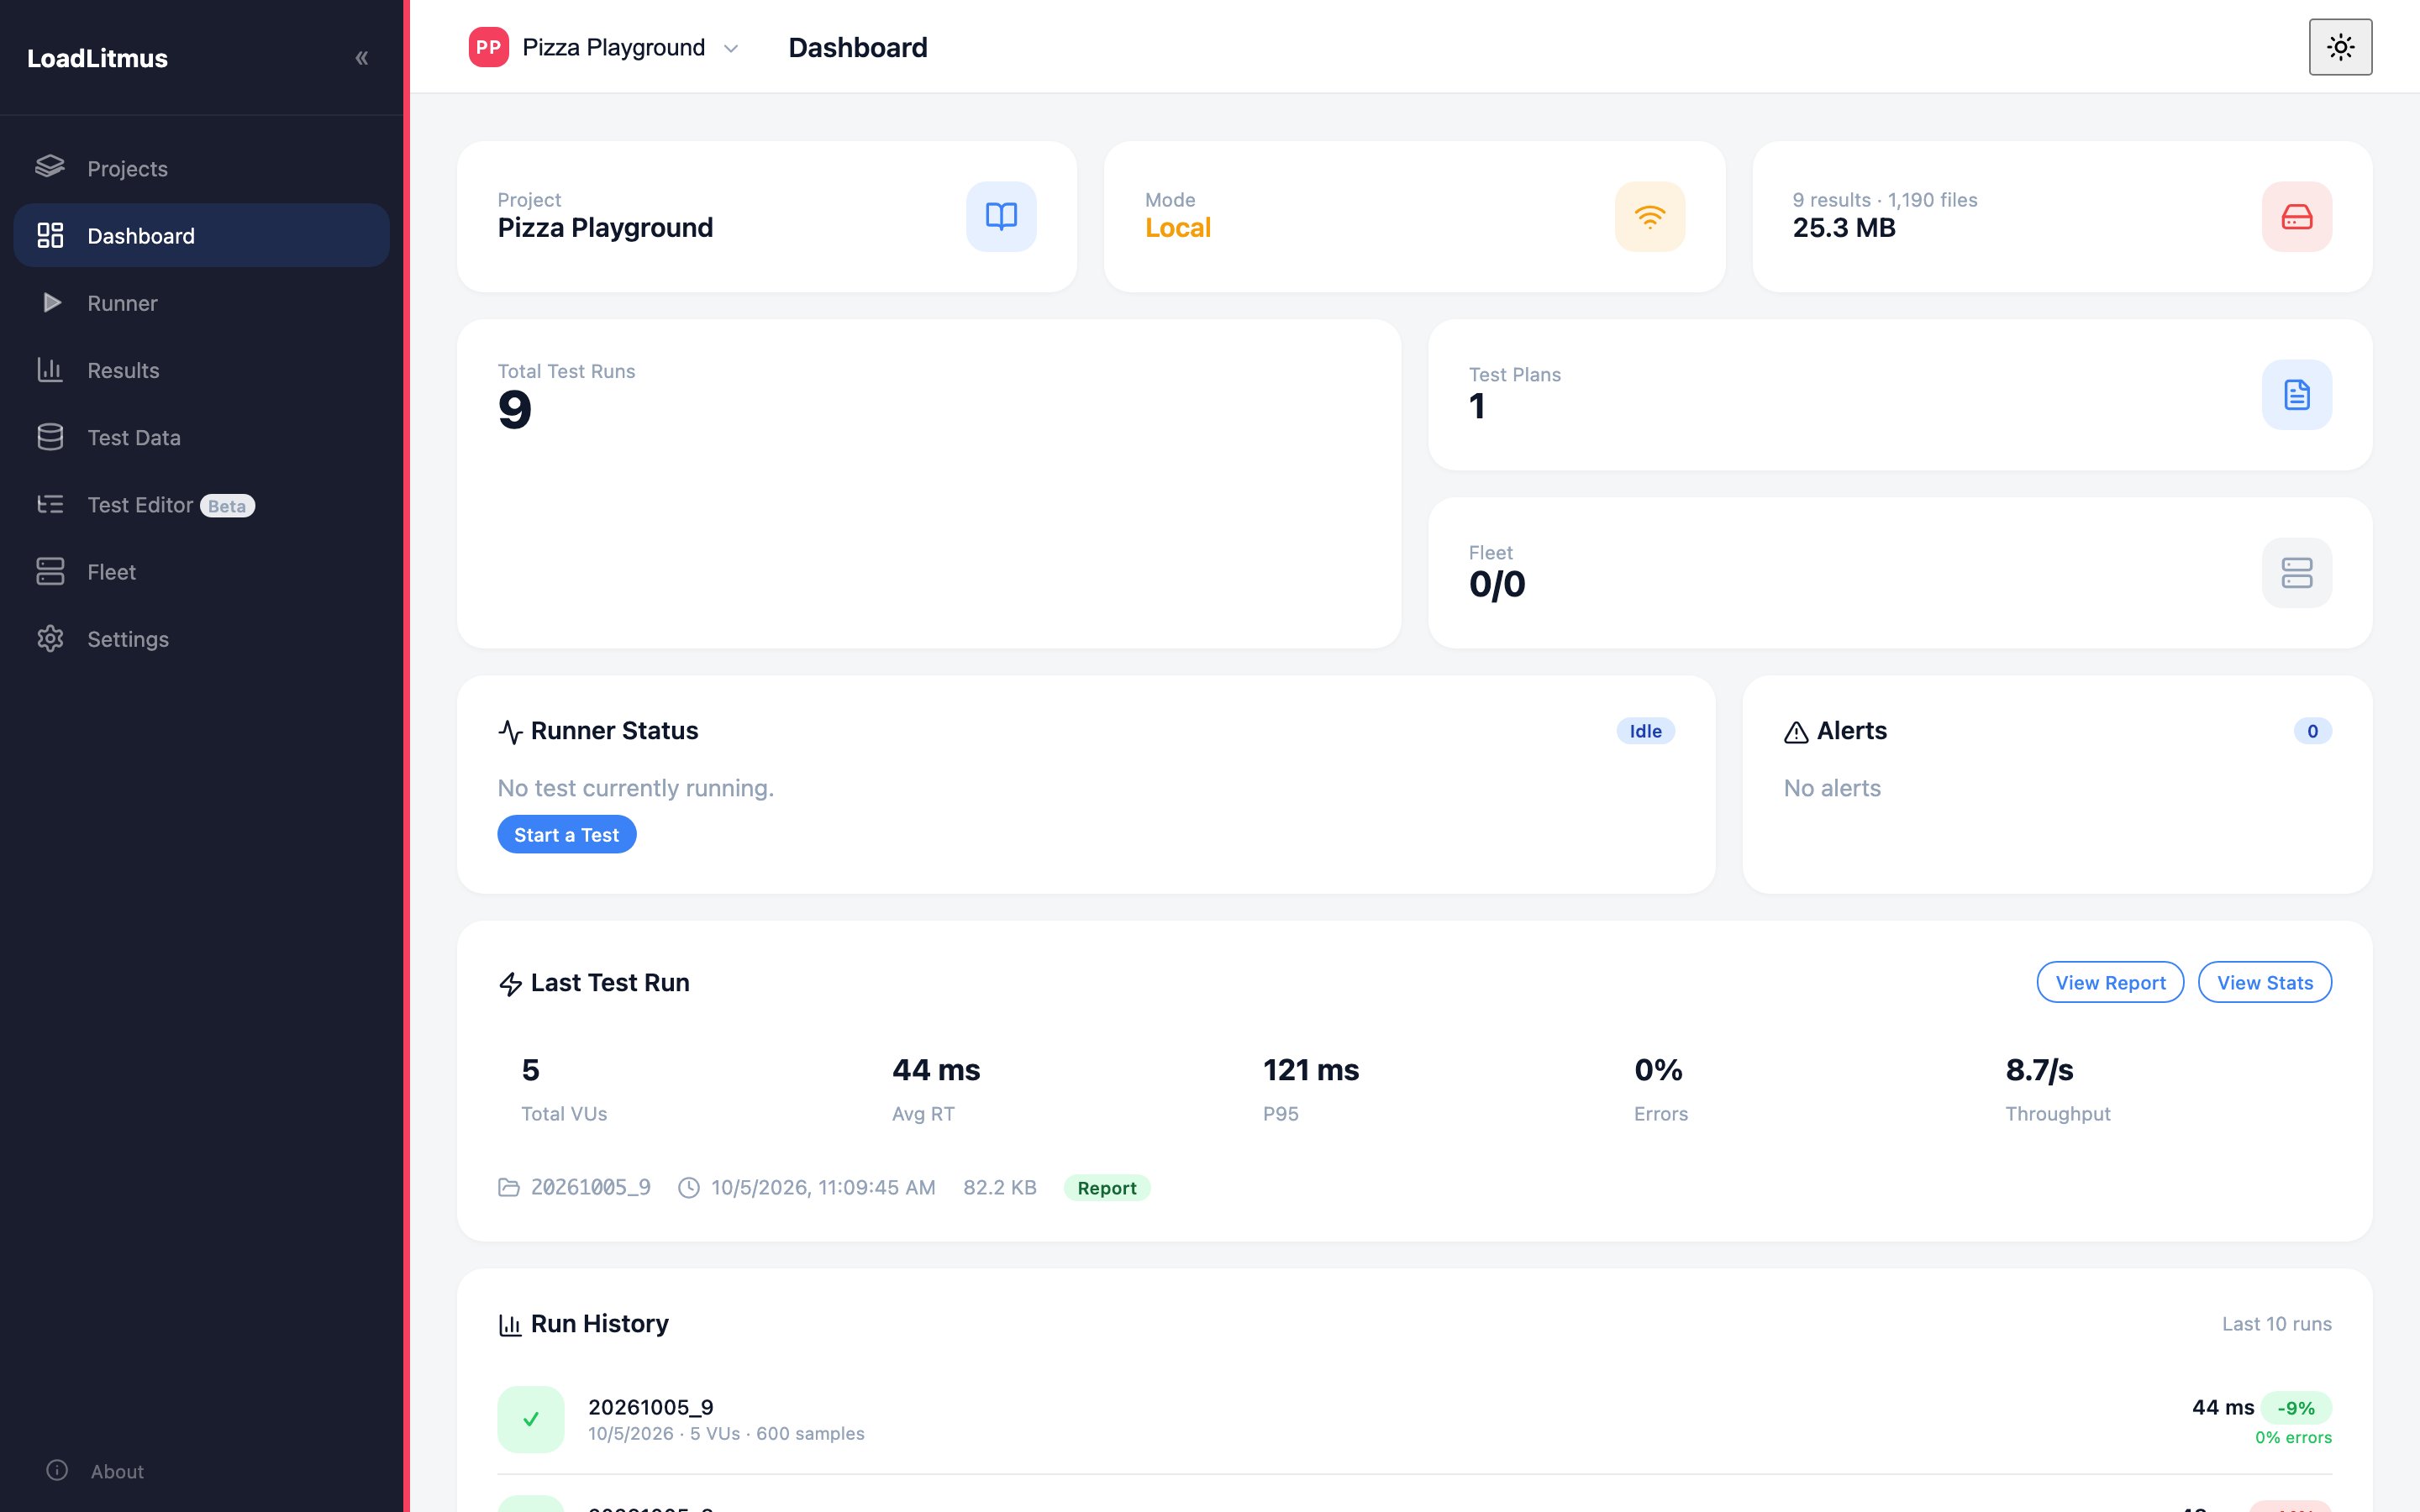
| Area | What you get |
|---|---|
| Projects | One folder per system under test: test plans, CSV data, results, settings |
| Runner | Pick a plan, set users/ramp/iterations, edit parameters, press Start, watch the log stream live |
| Results | Every run kept with its metrics, HTML report, comparison against another run, PDF/Markdown export |
| Test Data | A CSV browser and builder, and a way to push data files to slave machines |
| Test Editor (beta, known bugs) | A visual JMX editor, a browser recorder and HAR import |
| Fleet | Slave machines over SSH: provision, start, stop, health and metrics |
| Monitoring | Live charts during a run, when an InfluxDB is configured |
| CI mode | A headless run with pass/fail thresholds and webhook notifications |
What it is not
- Not a replacement for JMeter knowledge. It runs JMeter as a subprocess. A bad script is still a bad script — see the JMeter track.
- Not a script generator. The editor helps, but correlation is still your job.
- Not a cloud service. Nothing leaves the machine, which is why it passes PNC-style restrictions. The optional AI analysis runs against a local Ollama, not a hosted model.
- Not a database. There is no DB at all. Run history is derived from the
results/folder on disk, so copying that folder copies the history.
When to use what
| Situation | Use |
|---|---|
| Exploring a script, fixing correlation | JMeter GUI |
| A one-off smoke run on your own laptop | Either; jmeter -n -t is fine |
| A client engagement with repeat runs | LoadLitmus |
| Several people need to see the same results | LoadLitmus |
| Distributed load across several machines | LoadLitmus (Fleet), or JMeter's own -R if you enjoy pain |
| A run inside a pipeline | LoadLitmus CLI (python -m webapp run) |
Tips
- One project per system under test, not per test. "Student Portal" is a project; "login test" and "booking test" are two plans inside it.
- The project folder is the artefact. It can be zipped, exported and handed over. Keep client data in it and it goes with the handover.
- Treat the dashboard as the run record. If a run is not in LoadLitmus, it did not happen — that is how you avoid "which numbers were those?" three weeks later.