Running a Test
Everything happens on the Runner page. Pick a plan at the top, configure the cards down the page, watch Live Output below the form while it runs.
Select the plan
The dropdown lists every .jmx in the project's test_plan/ folder. Next to it: file size, last modified, an upload button, and a preset selector.
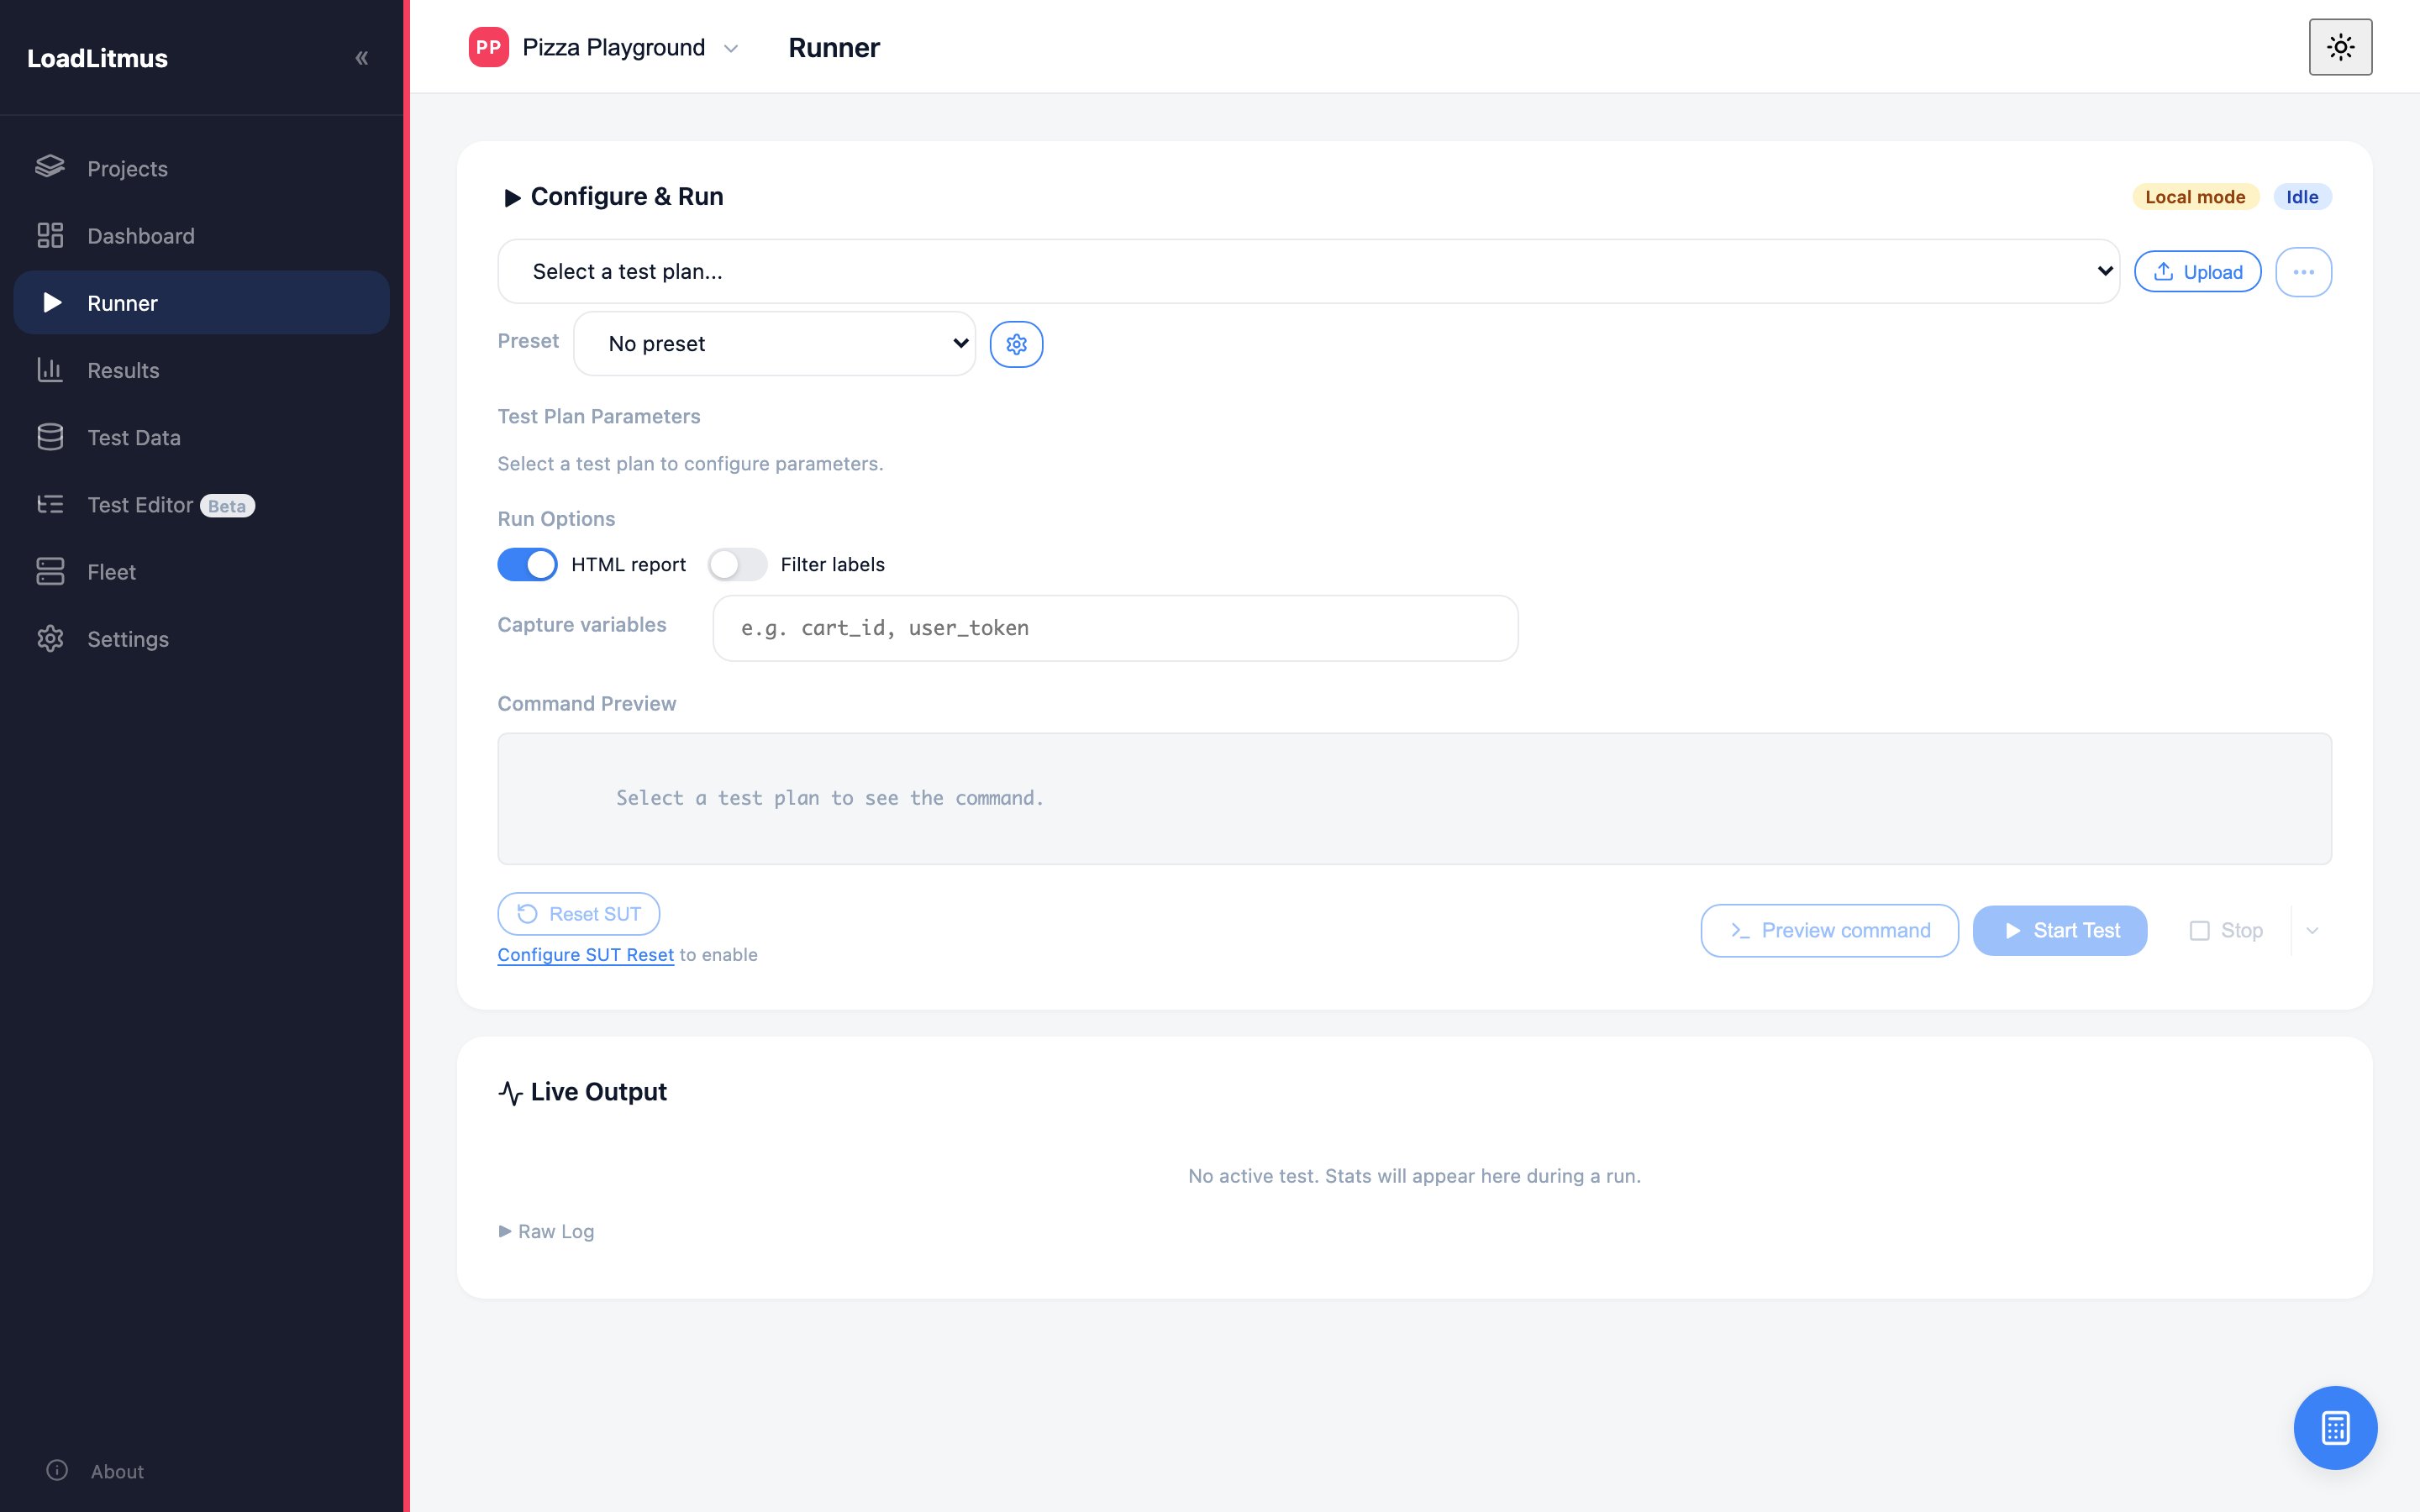
Until a plan is selected the Runner is empty: the parameters, command preview and Live Output wait for you to pick one.
Once a plan is selected the cards fill in. How well the script fits the dashboard shows in what you get: a script with parameterised load (${__P(...)}) gets editable Load fields, and a script with portable CSV paths lists its files under Test Data and works on slaves too.
If the Load card stays empty or the CSV paths are hard-coded, fix the script first — see Script Requirements.
Set the load
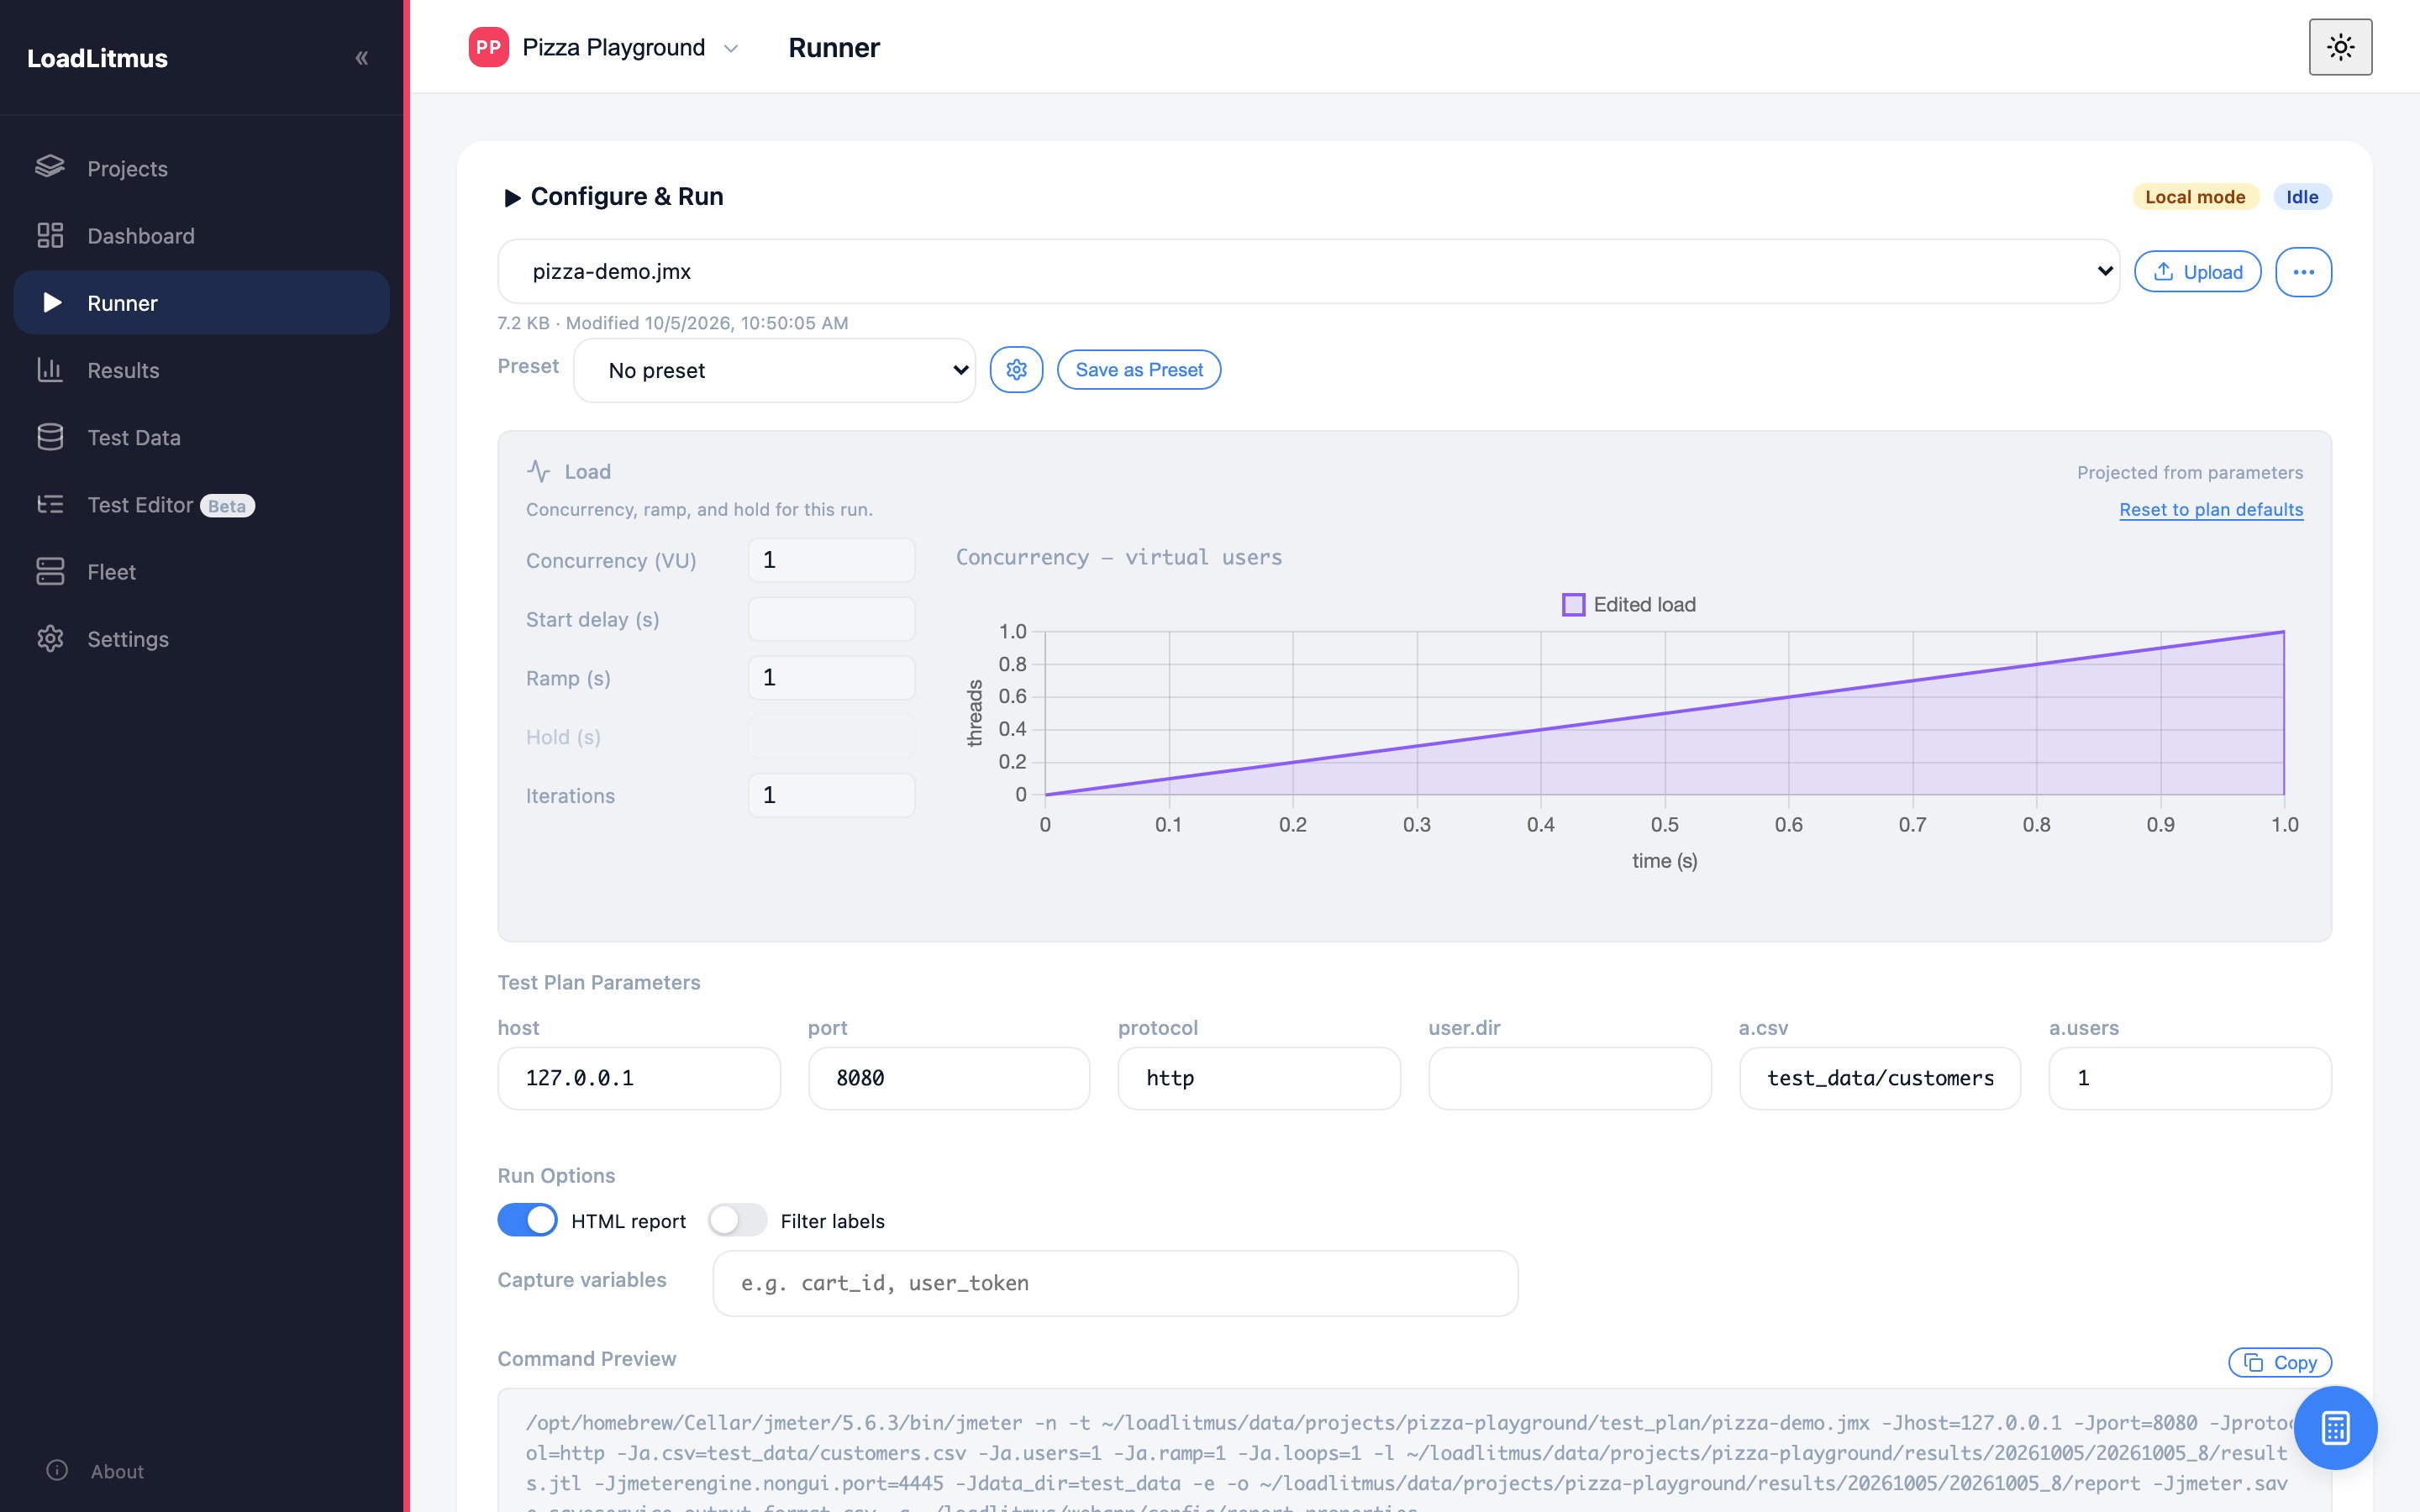
| Field | Meaning |
|---|---|
| Concurrency (VU) | Virtual users running at the same time |
| Start delay (s) | Wait before this group starts — useful to stagger personas |
| Ramp (s) | How long to reach full concurrency |
| Hold (s) | How long to stay there (needs the scheduler; greyed out otherwise) |
| Iterations | How many times each user repeats the flow |
The chart redraws as you type, so you can see the shape before you commit. Reset to plan defaults puts back what the file says. Your numbers apply to this run; the .jmx on disk is untouched.
A plan with several Thread Groups shows one row per group, so a mixed test — 50 browsing users plus 5 submitting users — is set up in one place.
Where the numbers should come from: the requirements, not a feeling. See Design Load Model in the JMeter track.
Parameters and test data
Below the Load card:
- Test Plan Parameters — one field per
${__P(...)}in the script. When the Load card is editable it takes over the parameters that back it, and those are hidden here. The demo plan'sa.usersis still listed in the picture below. Host, flags such assmoke, think times and passwords live here. - Test Data — the CSV files the plan reads, with a dropdown to swap in another file from the project's
test_data/folder for this run.

Whatever you type here applies to this run only; the file on disk is untouched.
Presets save a whole configuration — load, parameters, data — under a name. Make one per scenario ("smoke", "peak 500", "endurance") and the next person does not have to guess.
Start it
Press Start Test. The Live Output card below the form fills in:
- Throughput, average response, error rate, total samples, and active, started and finished VUs, as JMeter reports them.
- A live chart, and the raw JMeter log (click Raw Log) streaming over a WebSocket.
When the run ends you get a "Test completed" toast, a sound and, if you allowed them, a browser notification. The final figures stay in Live Output. Open the run from the Results page.
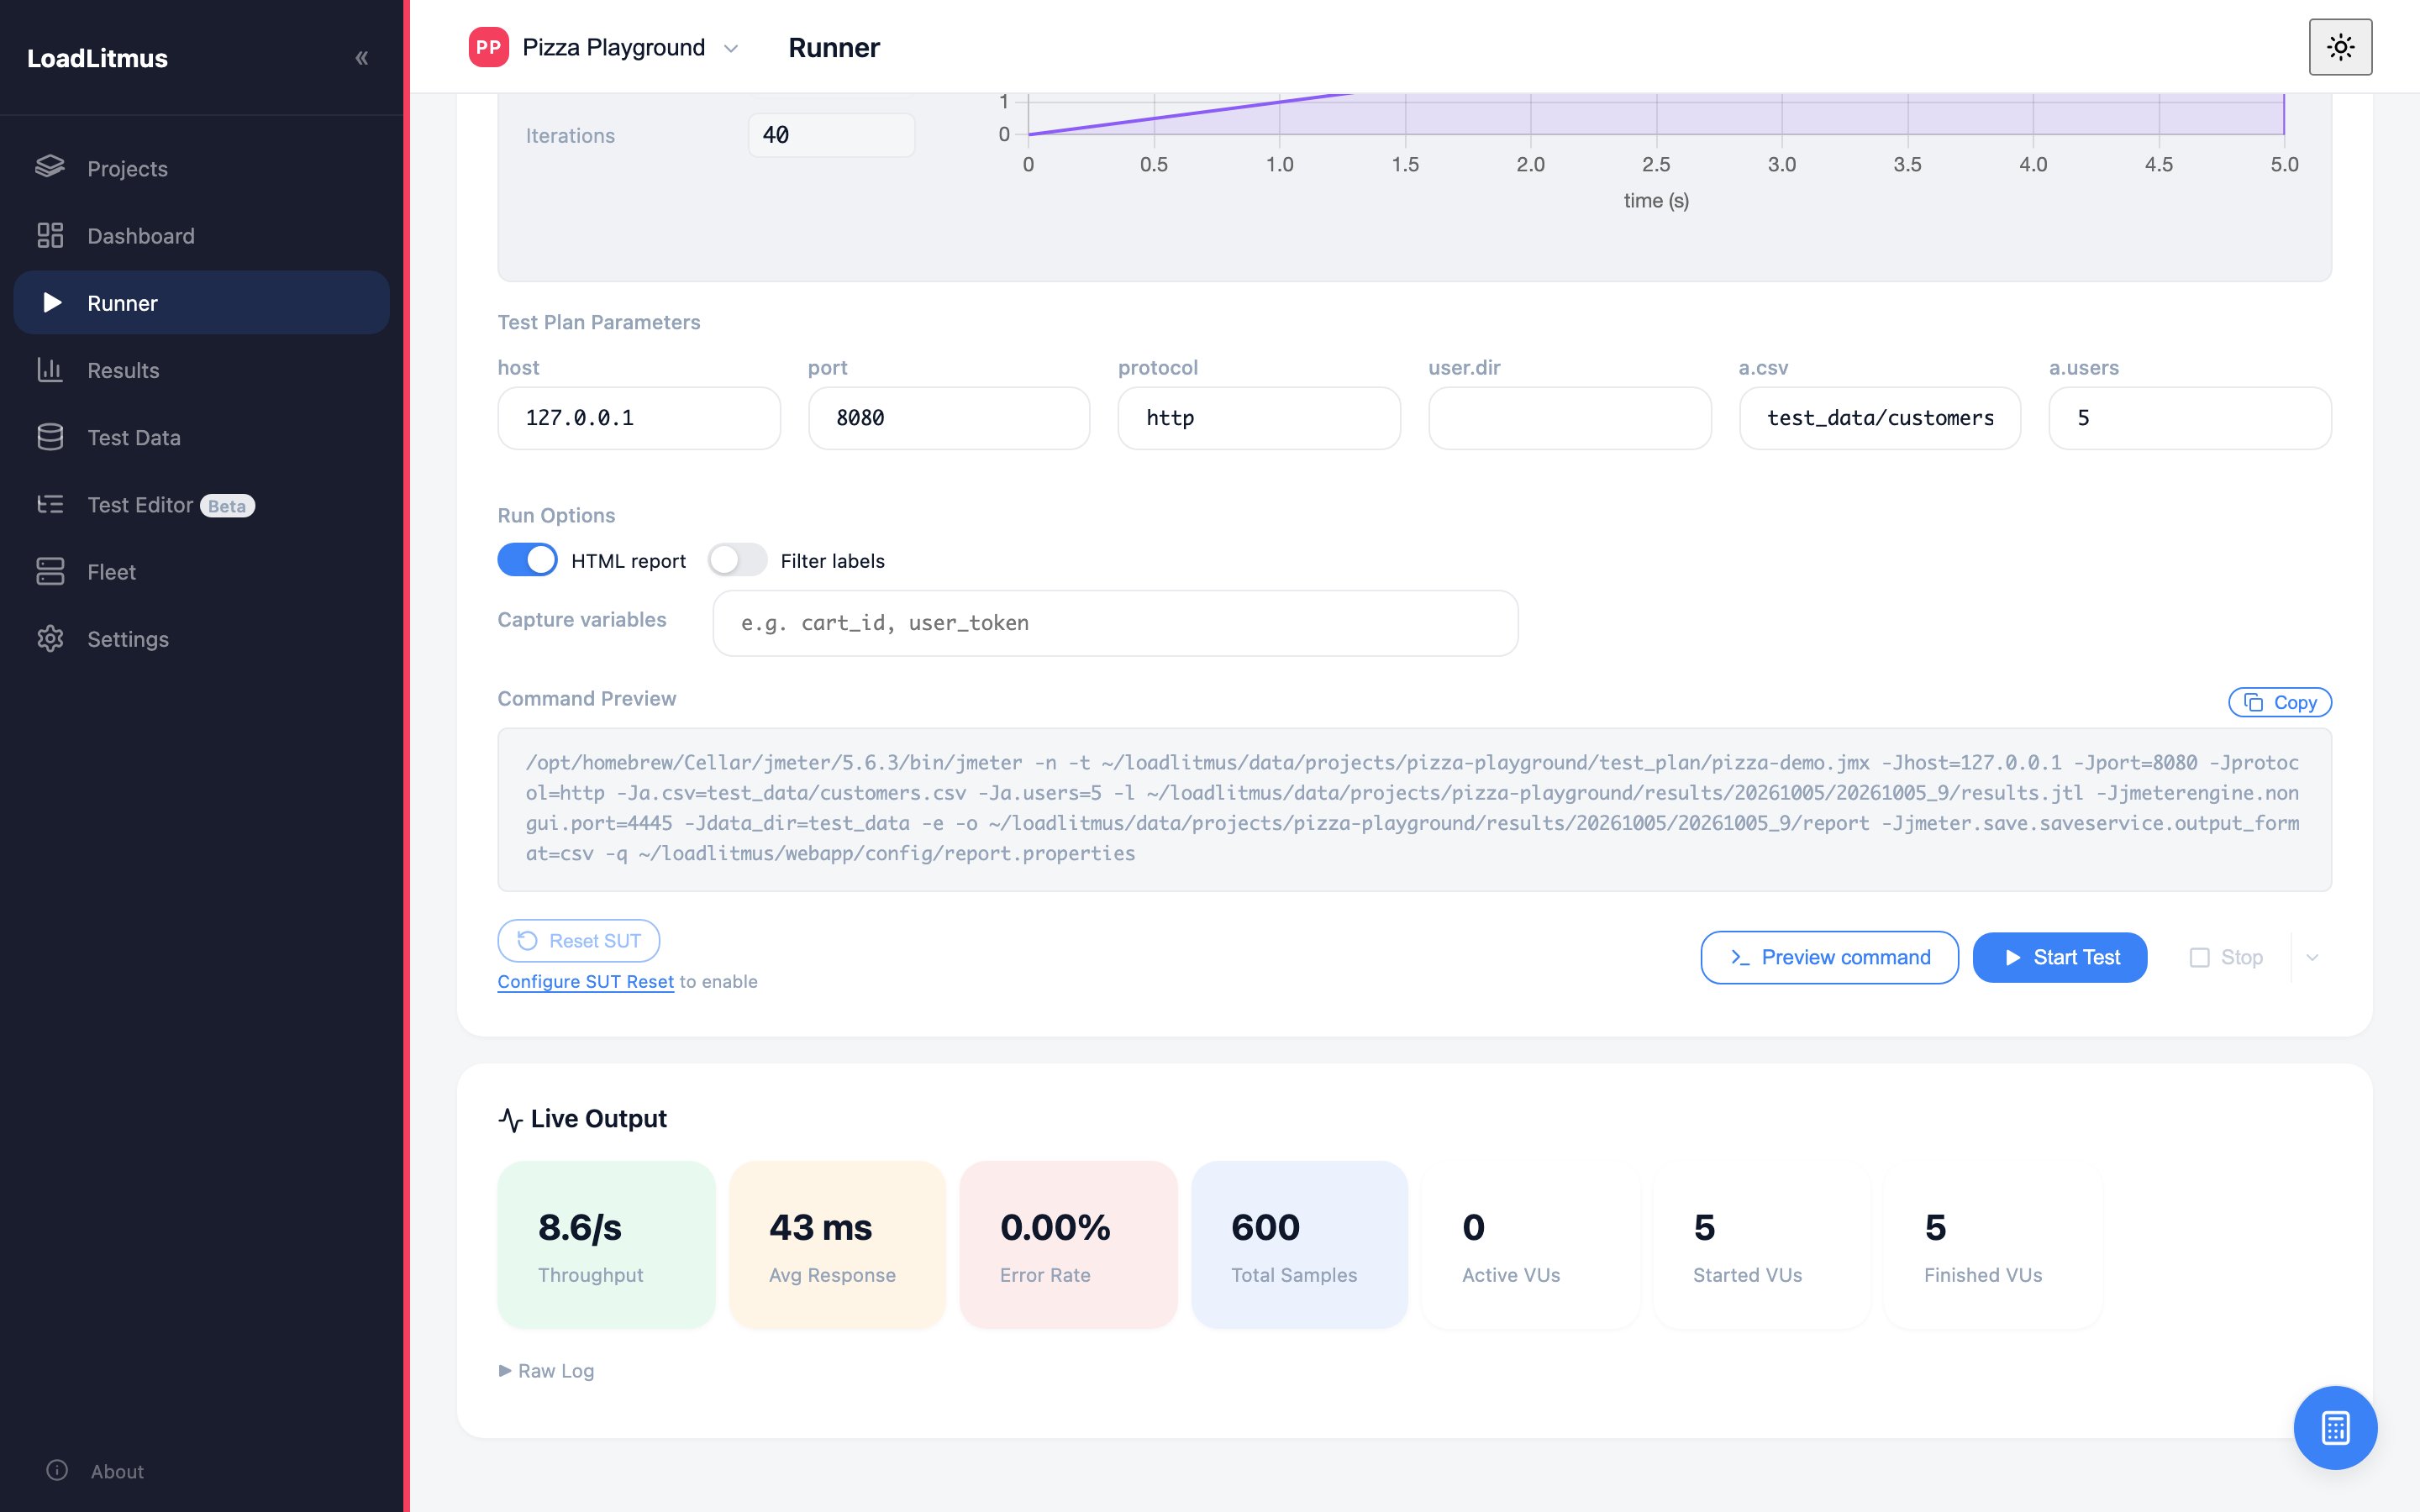
The whole loop — select the plan, set the load, start, watch, finish:
Live numbers appear on JMeter's summariser interval, not instantly. On a short run the cards may stay empty and only the final figures land in the results — that is JMeter's reporting cadence, not a broken dashboard.
Stopping
The Stop button has three modes, and they escalate:
| Mode | What happens | Use when |
|---|---|---|
| Graceful Stop | Threads finish the request they are on, then exit | Normal end; results stay clean |
| Immediate Stop | In-flight requests are aborted | The system under test is in trouble |
| Force Kill | The process is killed | Nothing else worked; JTL may be incomplete |
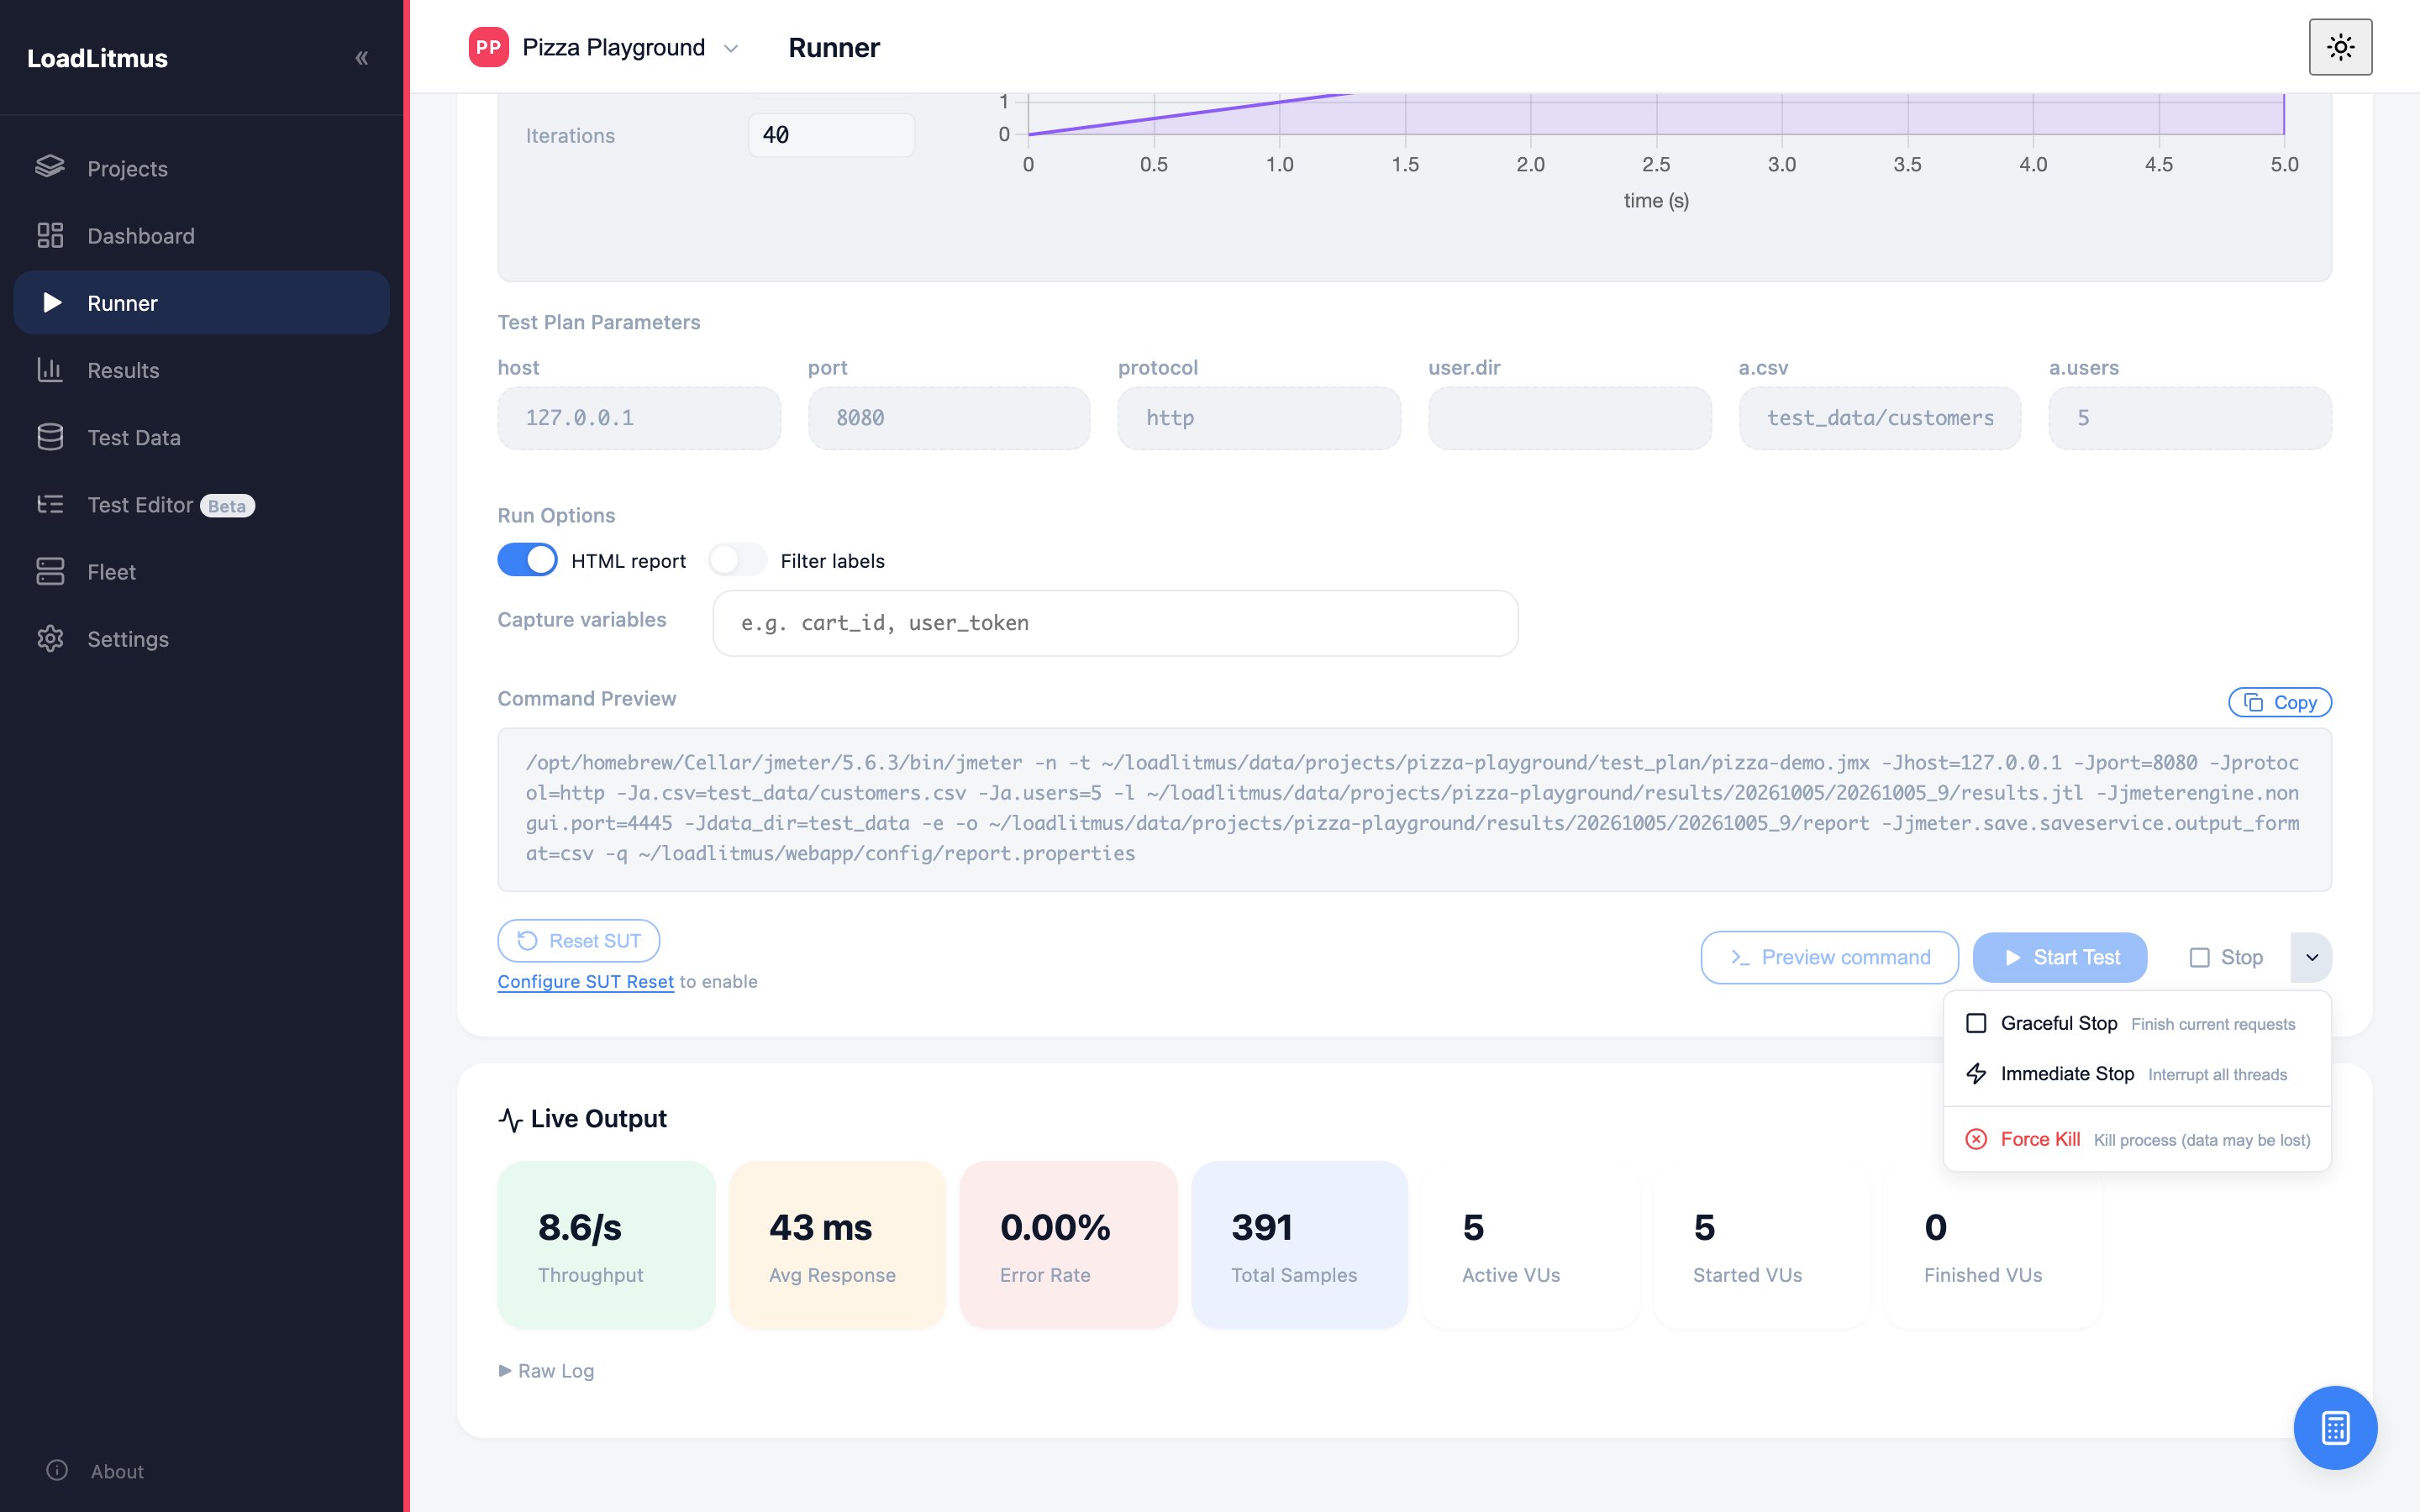
Graceful and immediate talk to JMeter over the UDP shutdown port (4445). If JMeter ignores them, LoadLitmus escalates on its own in the background.
Always try graceful first. A force kill can leave a partial JTL, and a partial JTL makes a misleading report.
If a run is already going
One instance runs one test at a time. When you start a second, you choose what happens: queue it, wait, or cancel. On a shared test server, tell the team which project is running — the dashboard header shows it.
Running from CI
The Copy for CI button gives you the exact command for the configuration on screen, which is the honest way to keep pipeline runs identical to manual ones:
python -m webapp run --plan starter-demo.jmx --threads 50 \
  --max-p95-rt 2000 --max-error-rate 1 --output json --notify
| Flag | Purpose |
|---|---|
--plan | Which .jmx |
--threads | Users |
--thresholds | Path to a thresholds.json instead of individual flags |
--max-avg-rt, --max-p95-rt, --max-error-rate, --min-throughput | Pass/fail gates |
--output json | Machine-readable result for the pipeline |
--notify | Fire the project's webhooks |
The exit code reflects the thresholds, so the pipeline fails when performance regresses.
Tips
- Smoke first, always. One user, one iteration,
smoke=true. If the script is wrong you find out in 30 seconds instead of at minute 20 of a load test. - Write down what changed between runs. Result folders are named by date (
20260923_4), so keep a line per run in the project README — "20260923_4: after the index fix" — or you will be comparing numbers you cannot explain. - Watch the error rate in the first minute. A script fault usually shows itself immediately; a system fault usually appears as load builds.
- Don't run the dashboard on the machine under test. You would be measuring your own load generator.