Getting Around
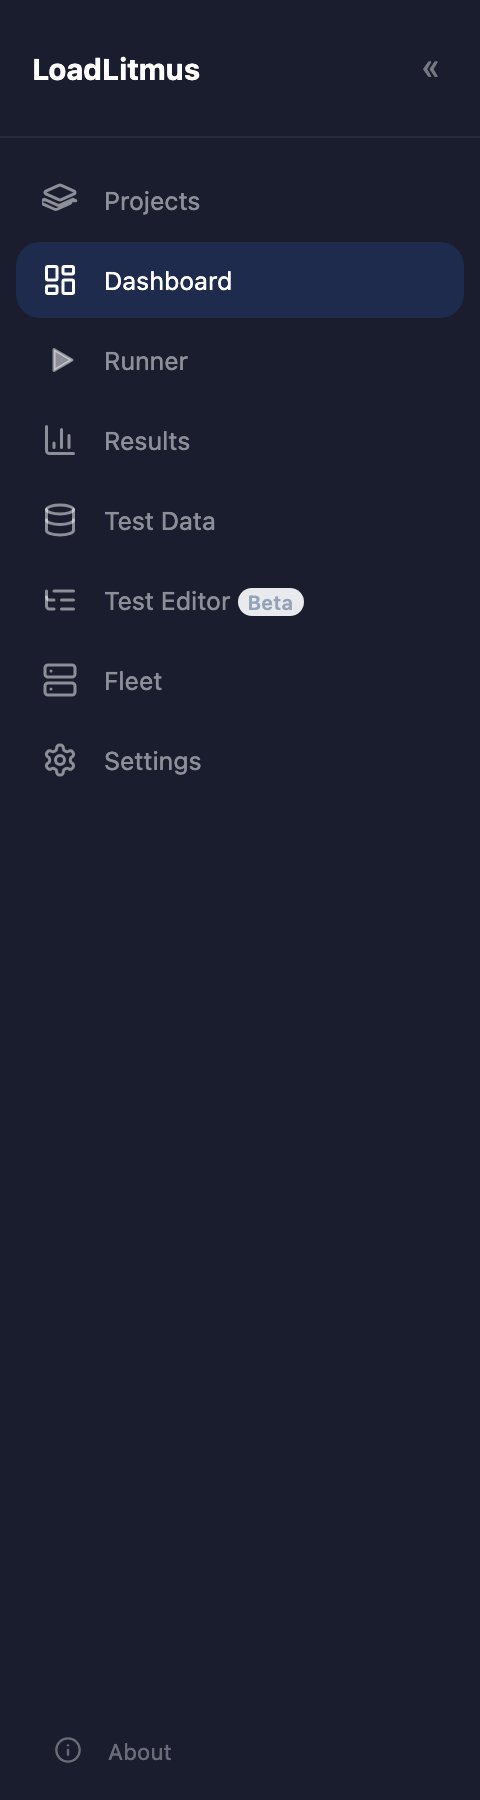
The sidebar has two kinds of items. Project pages (Dashboard, Runner, Results, Test Data, Test Editor) act on the project picked in the switcher at the top of the page. App pages (Projects, Fleet, Settings, About) are shared by every project.
Projects
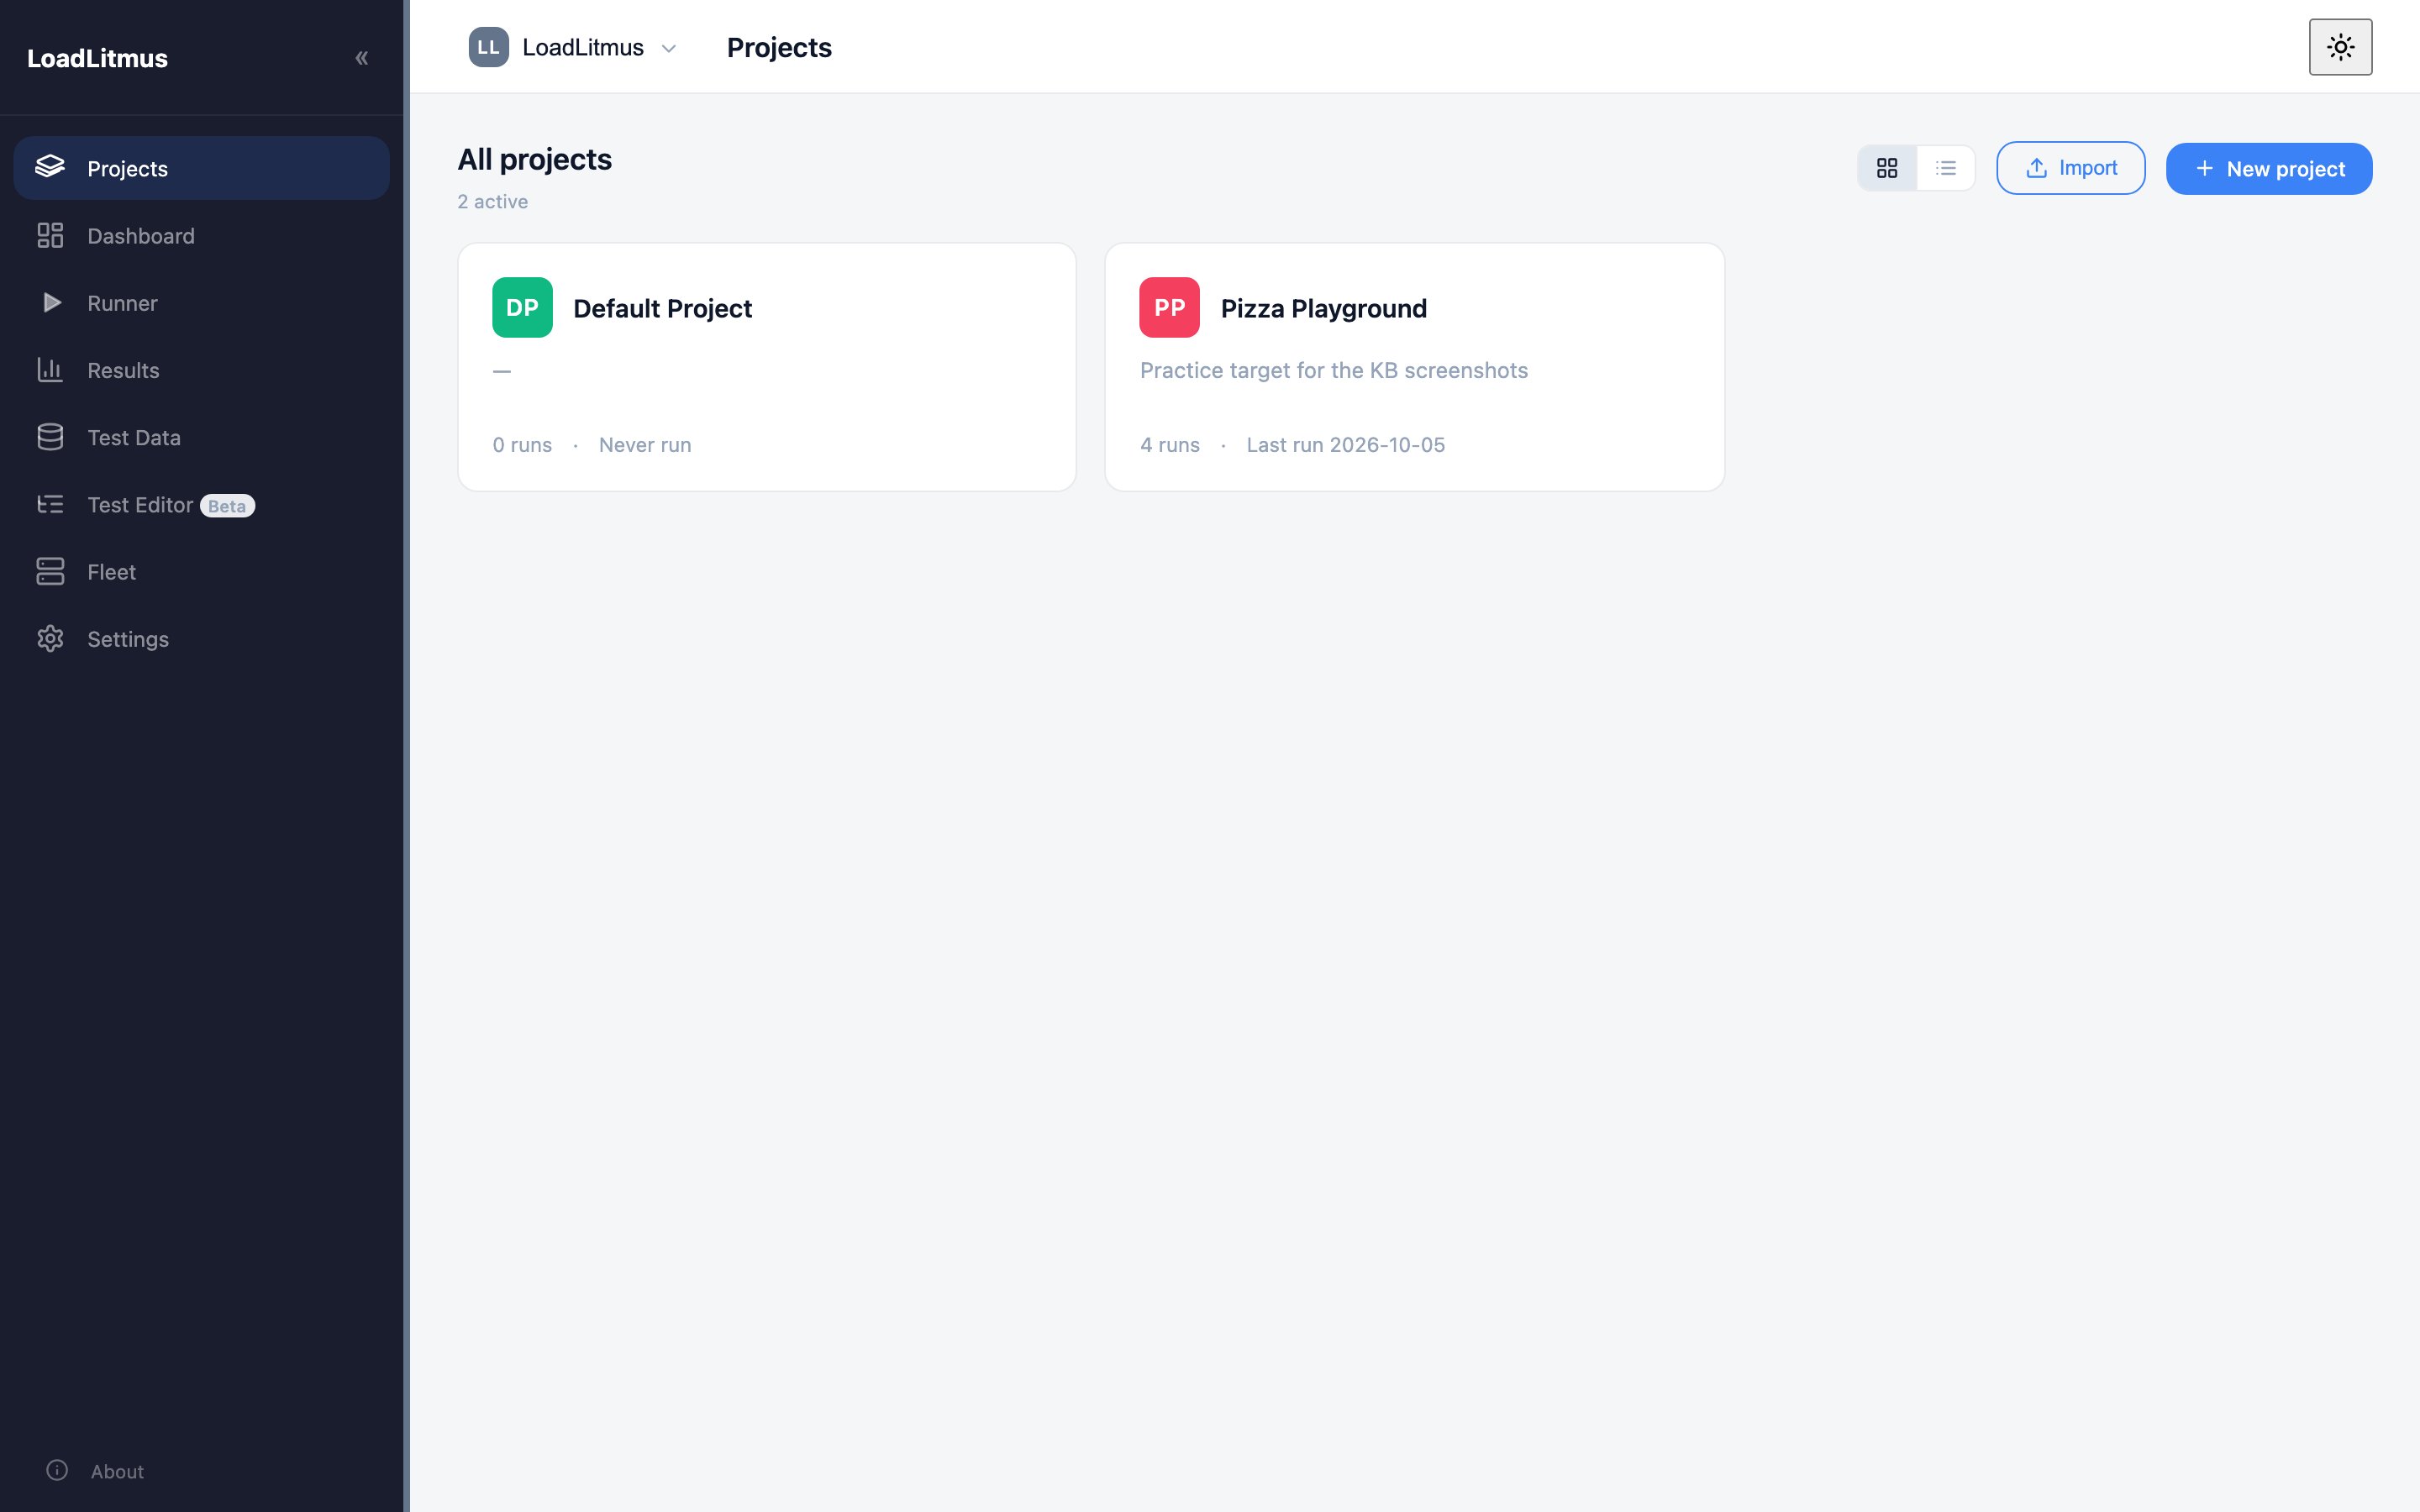
The card grid of every project on this install. Open it to switch project, create a new one, or reach archived and recently deleted projects. A project is one folder holding the plans, data, results and settings for one system under test.
More: Install and First Project
Dashboard
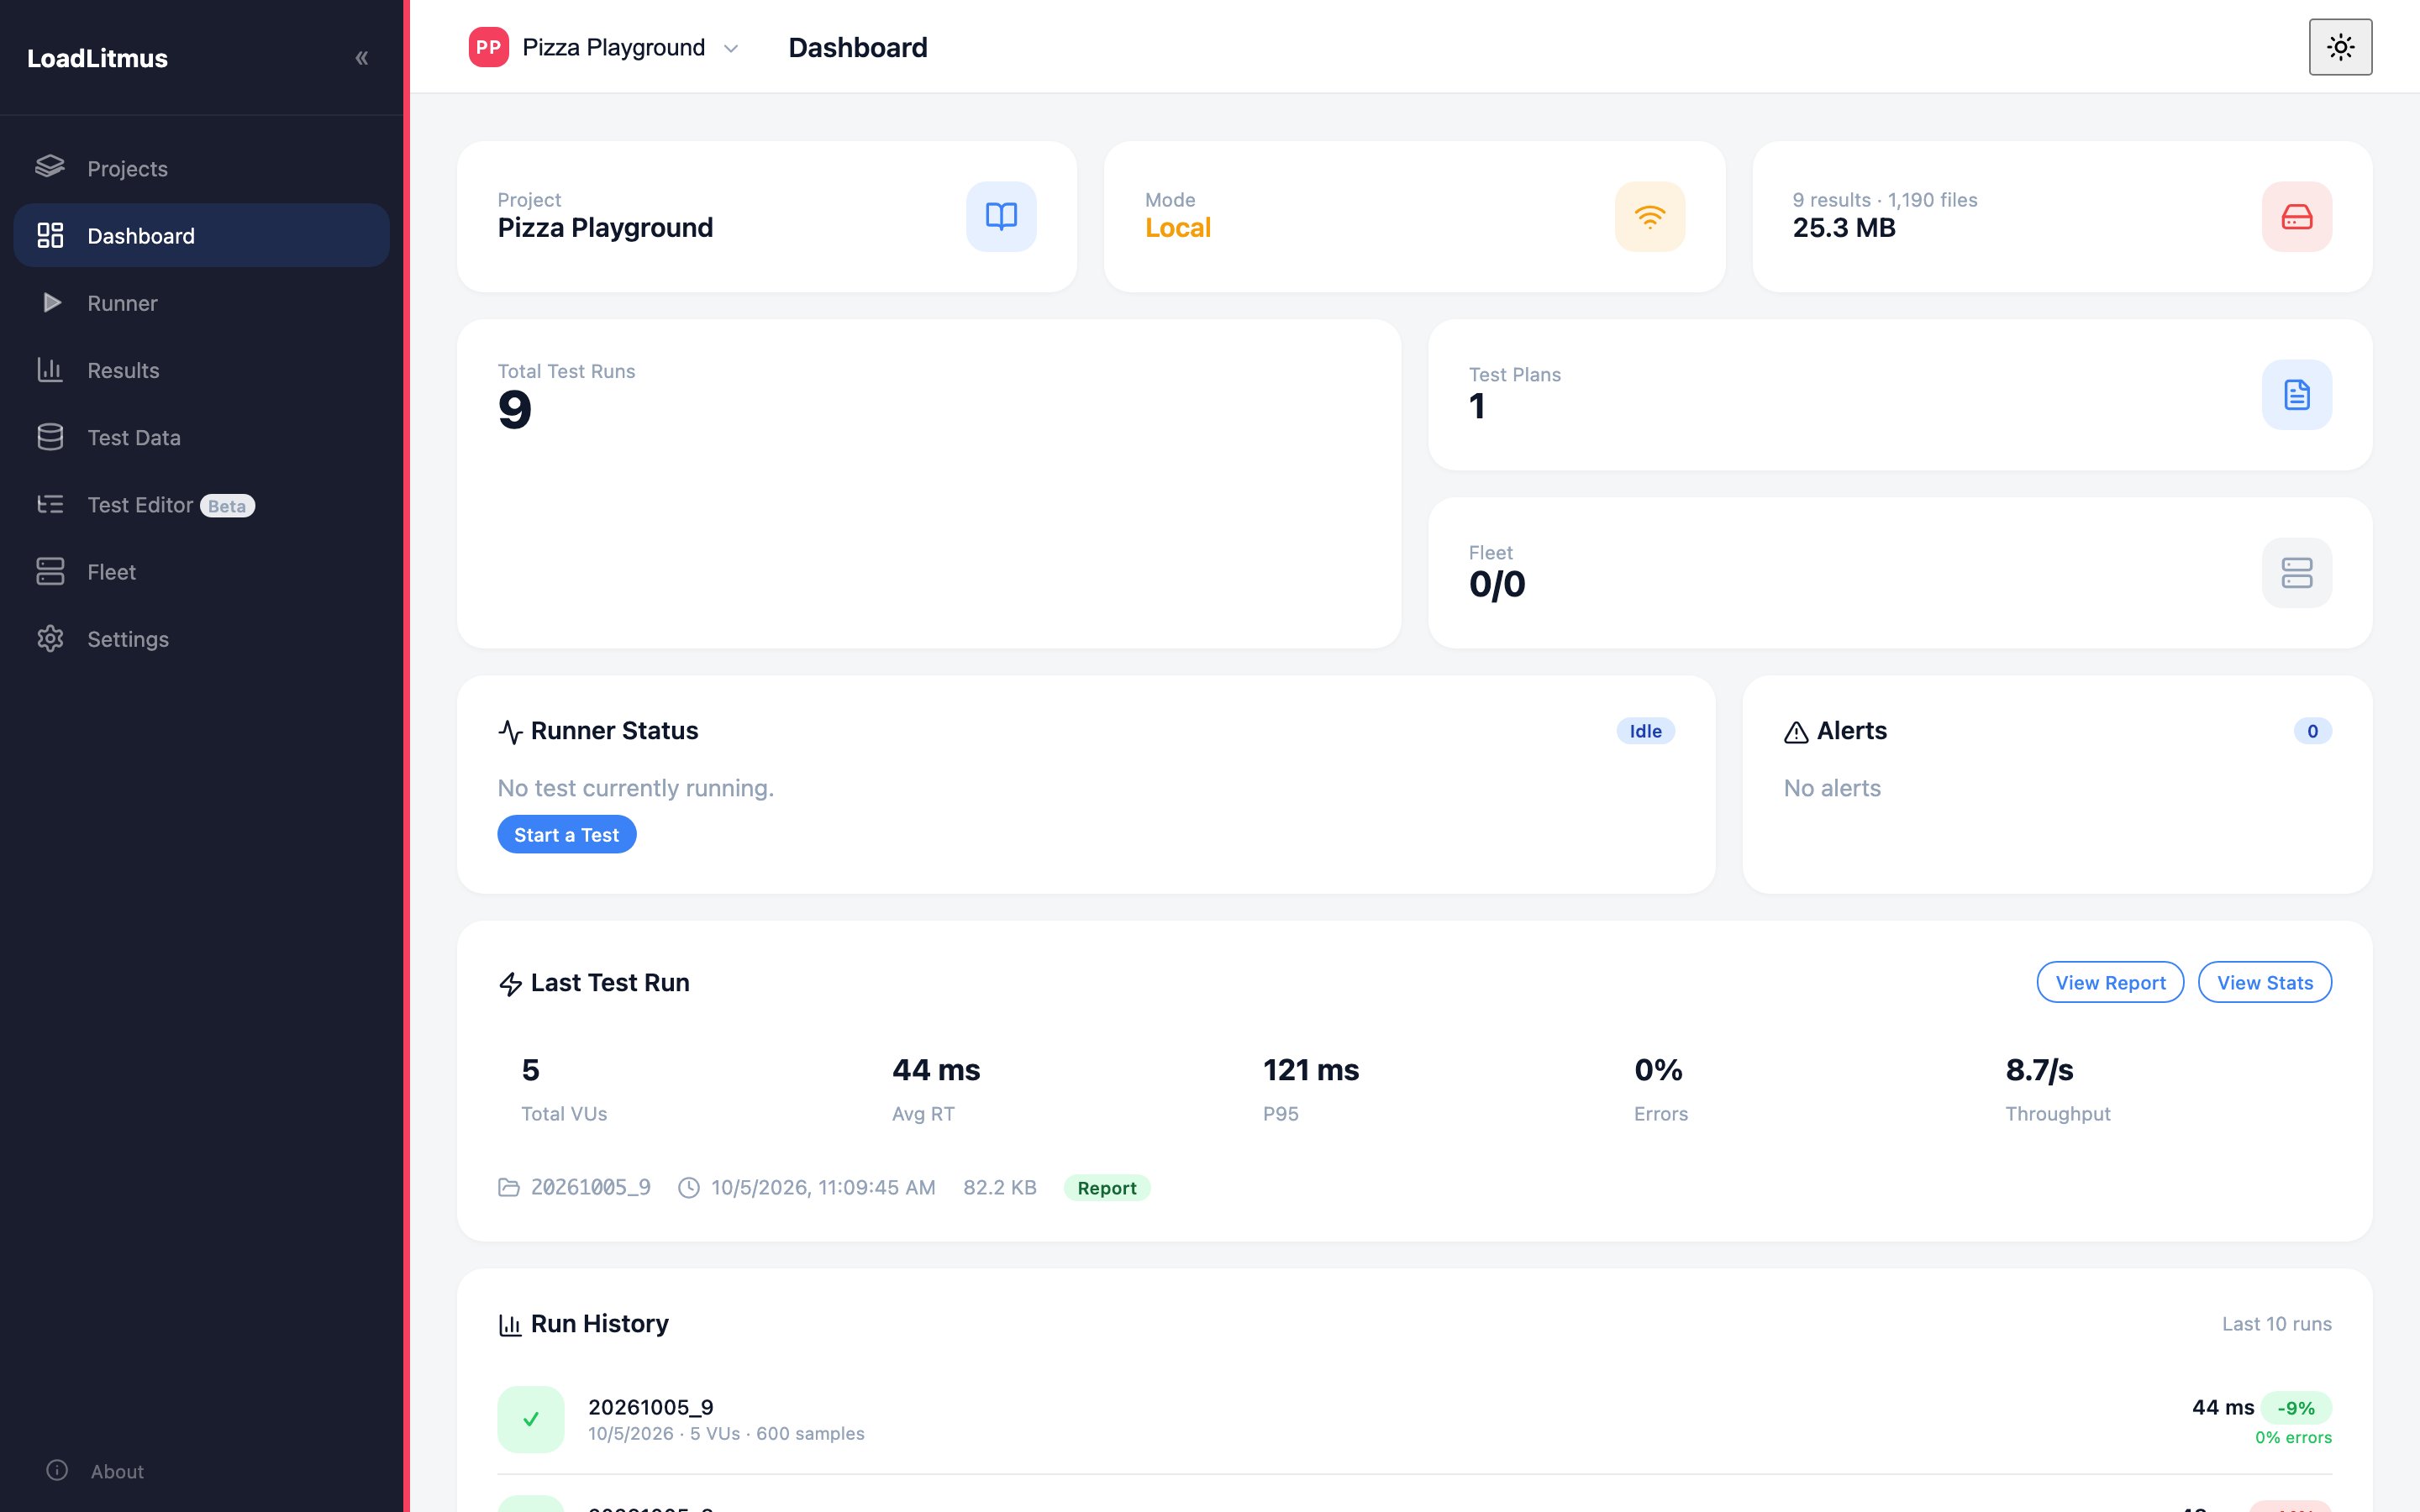
The landing page of a project: runner status, alerts, the last test run and a run-history chart. Open it to see where the project stands before you start anything. Project settings are one click away from the Projects page (see Settings below).
More: What LoadLitmus Is
Runner
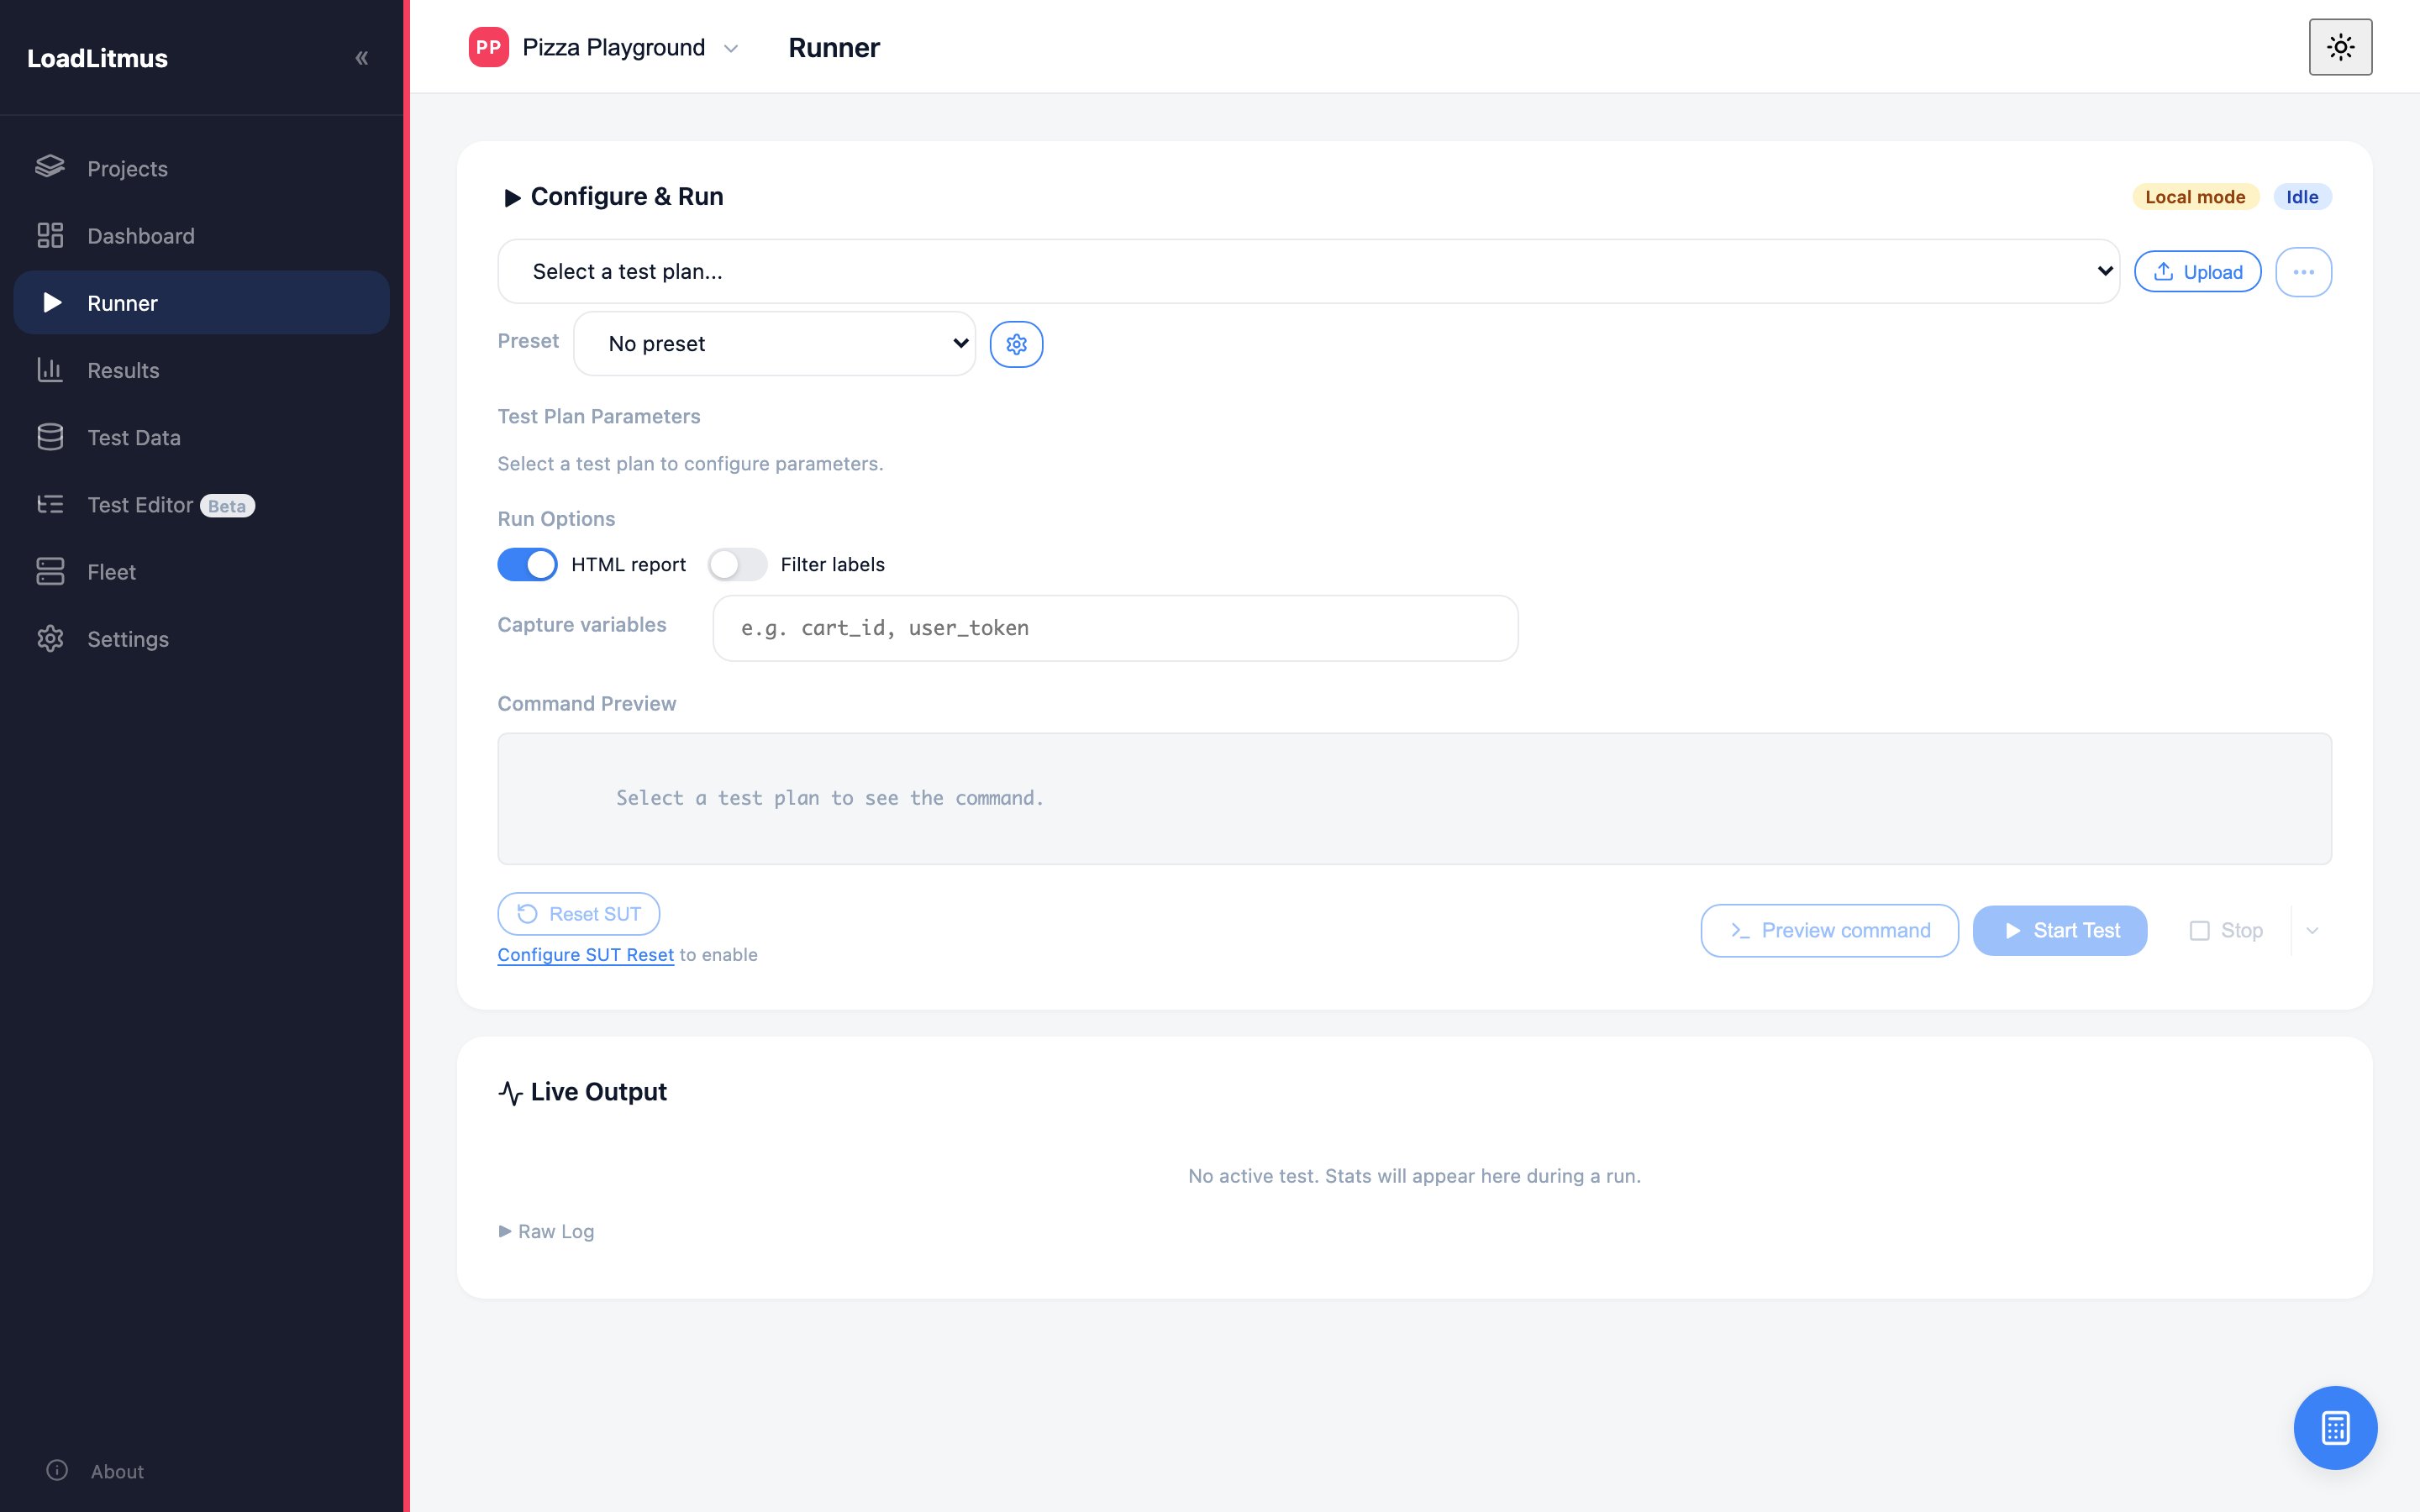
Where tests start. Pick a test plan, optionally a preset, fill in the plan's parameters, then preview the command and press Start Test. Live output and the Stop menu sit on the same page. Open it for every run. The sidebar entry says Runner; the page route is /plans.
More: Running a Test
Results
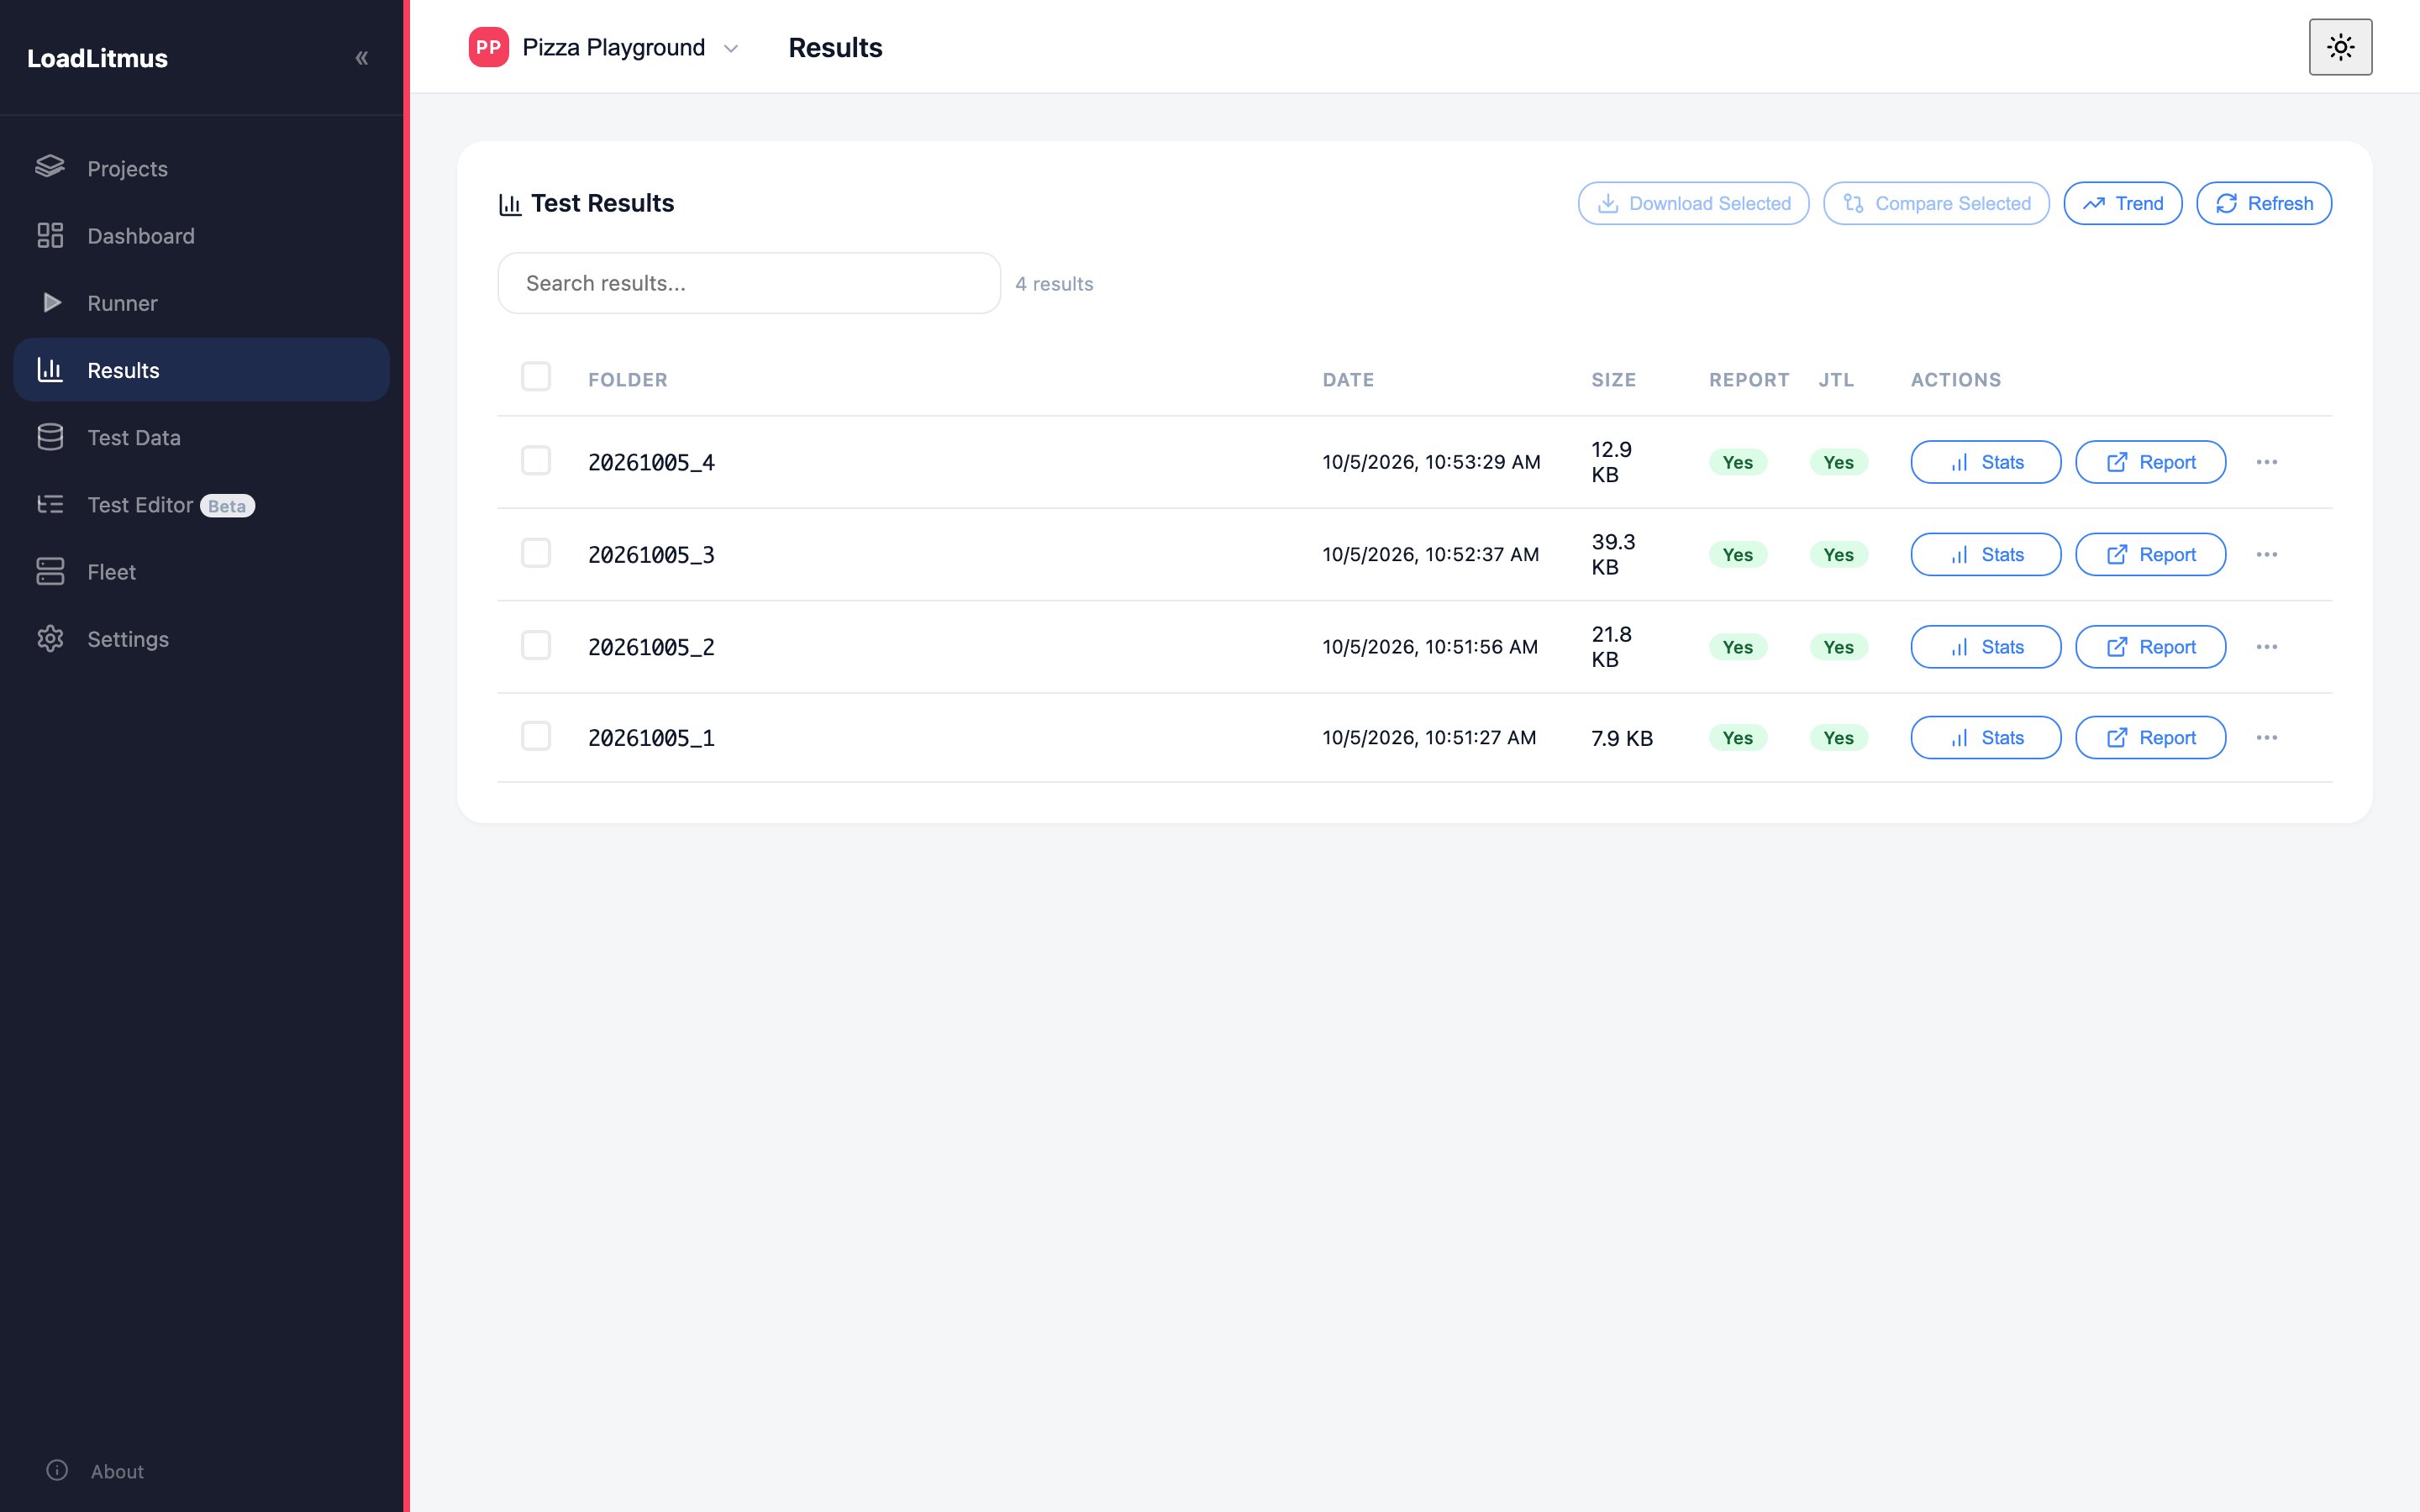
Every run of the project as a row: folder, date, size, and whether a report and JTL exist. Open Stats or Report for one run, tick two runs to compare them, or use the row menu for downloads and exports.
More: Results and Monitoring
Test Data
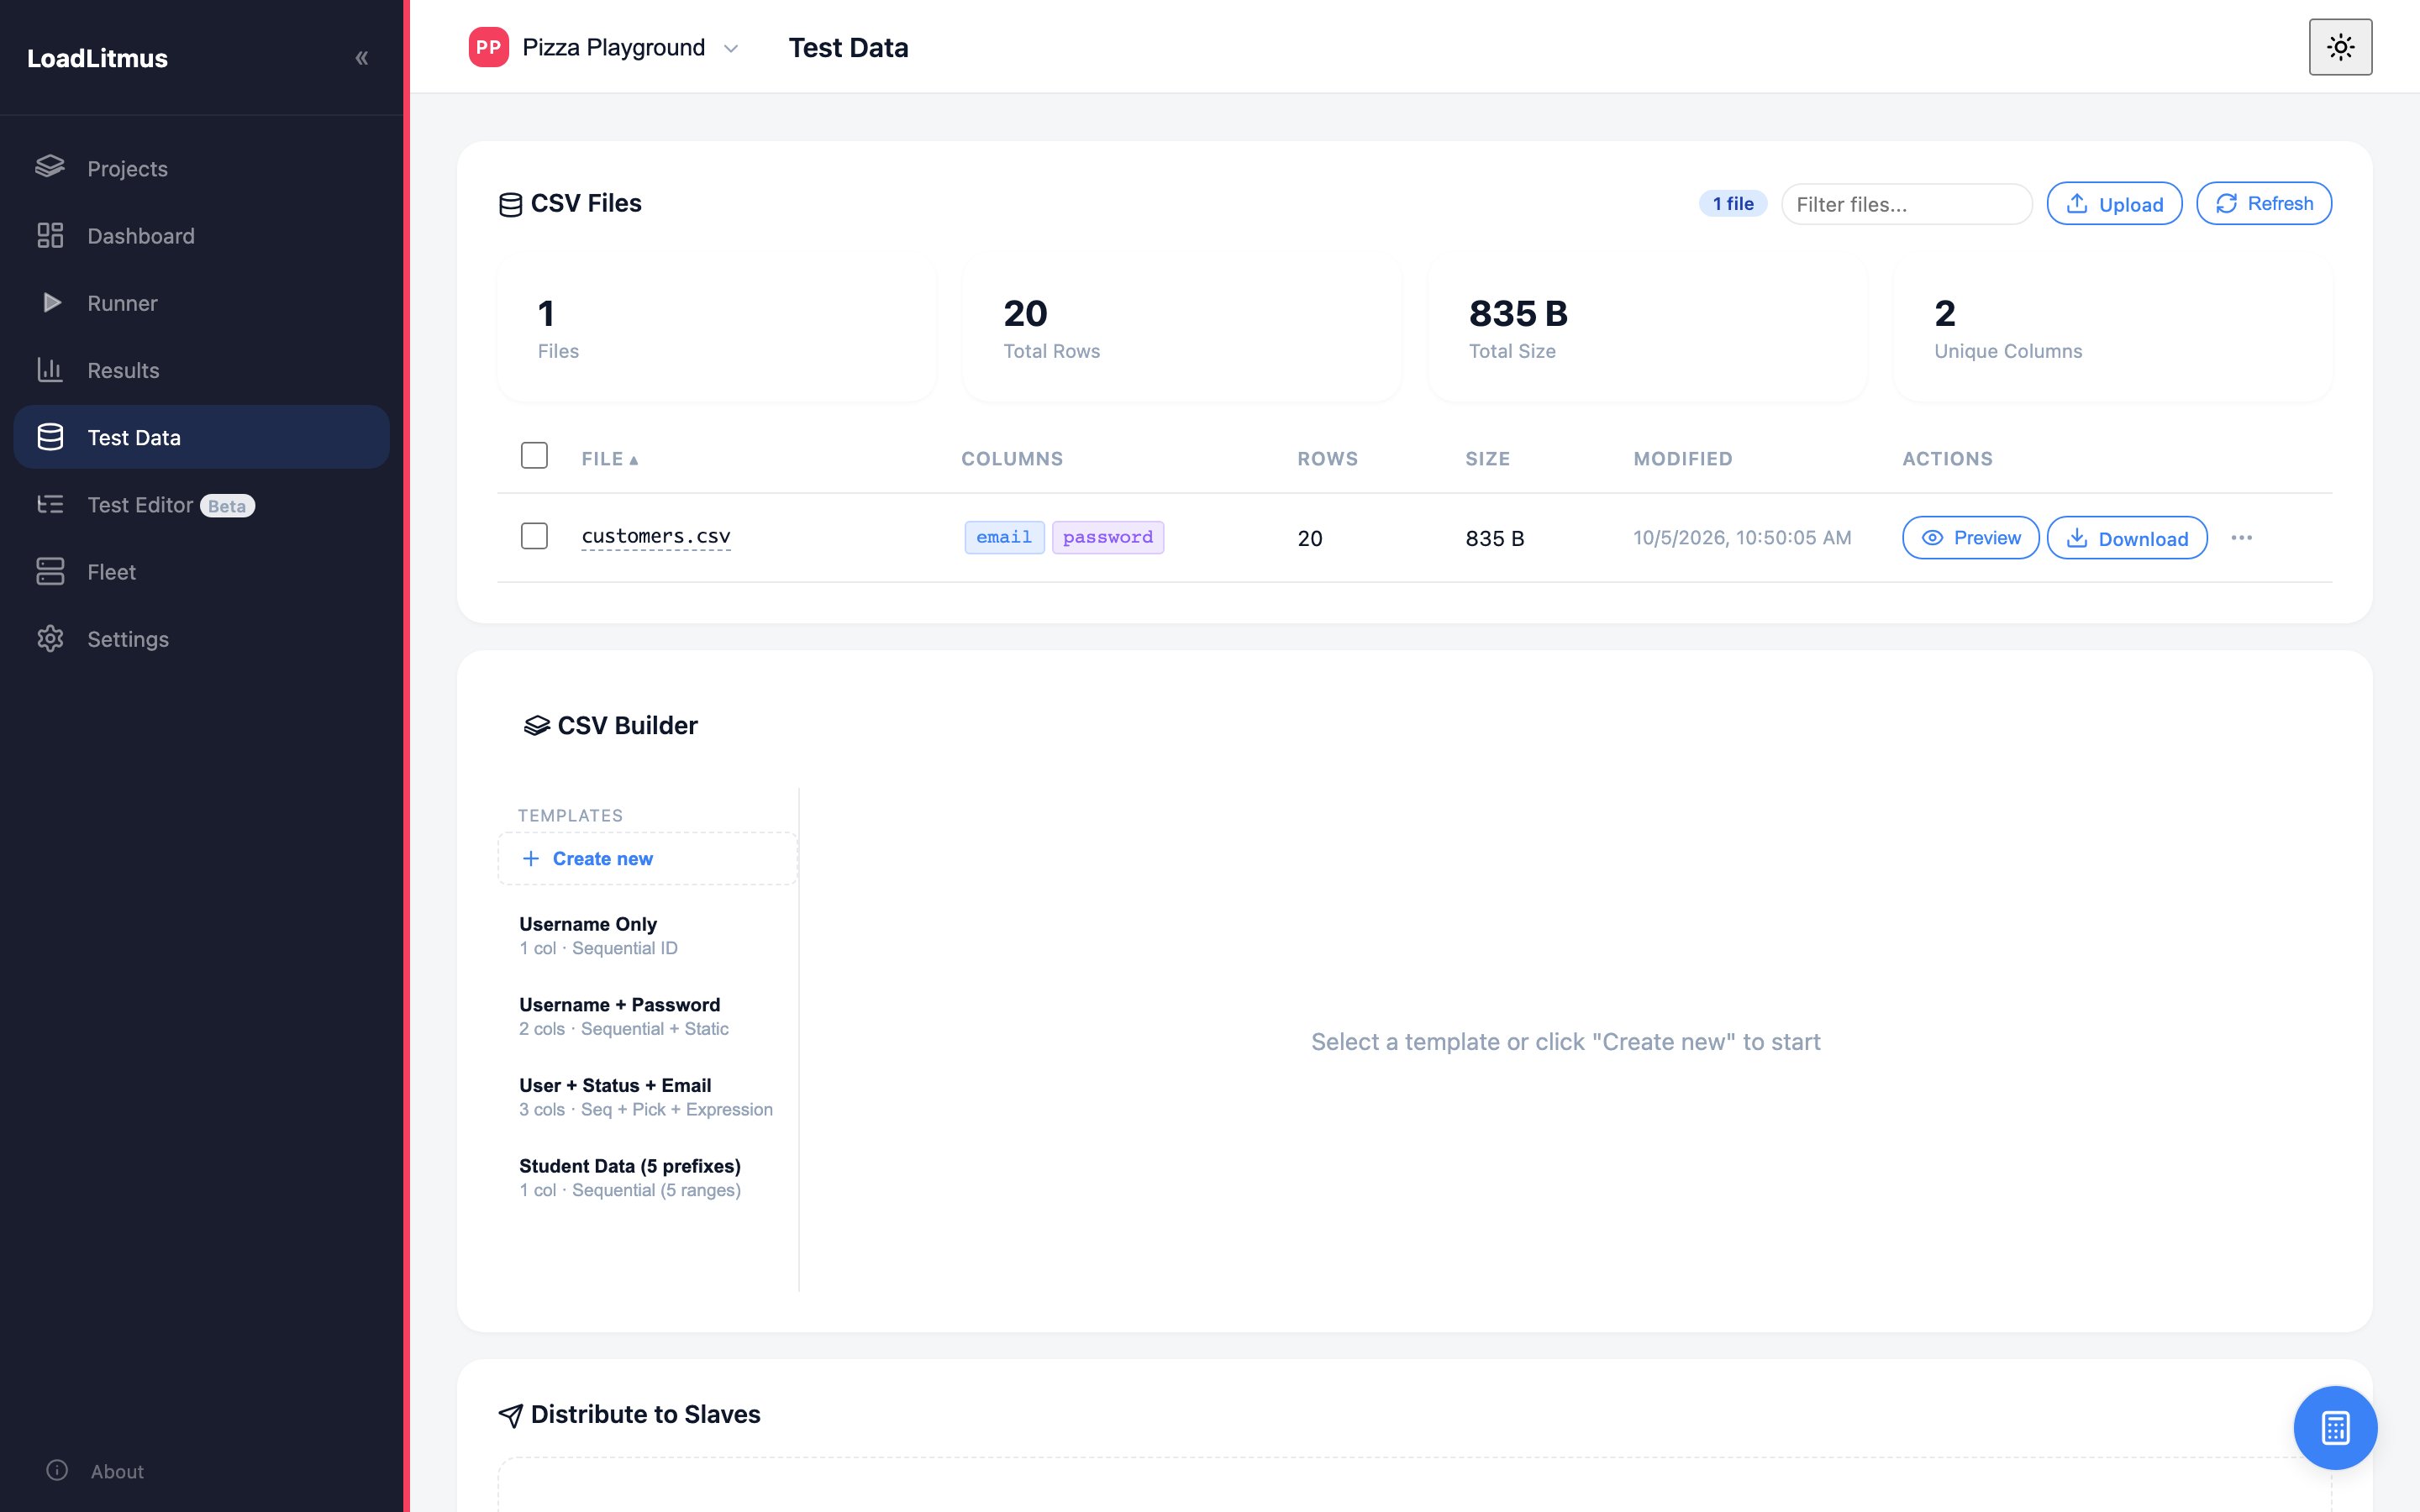
The project's CSV files with their columns and row counts, a CSV Builder with templates, and a Distribute to Slaves section. Open it when a script reads a CSV, or when you need to generate one.
More: Script Requirements
Test Editor
Warning: Test Editor is in beta and has known bugs. Use it to look at a script, not as the place you build one. Keep a copy of the
.jmxbefore saving from the editor, and check changes in JMeter's own GUI.
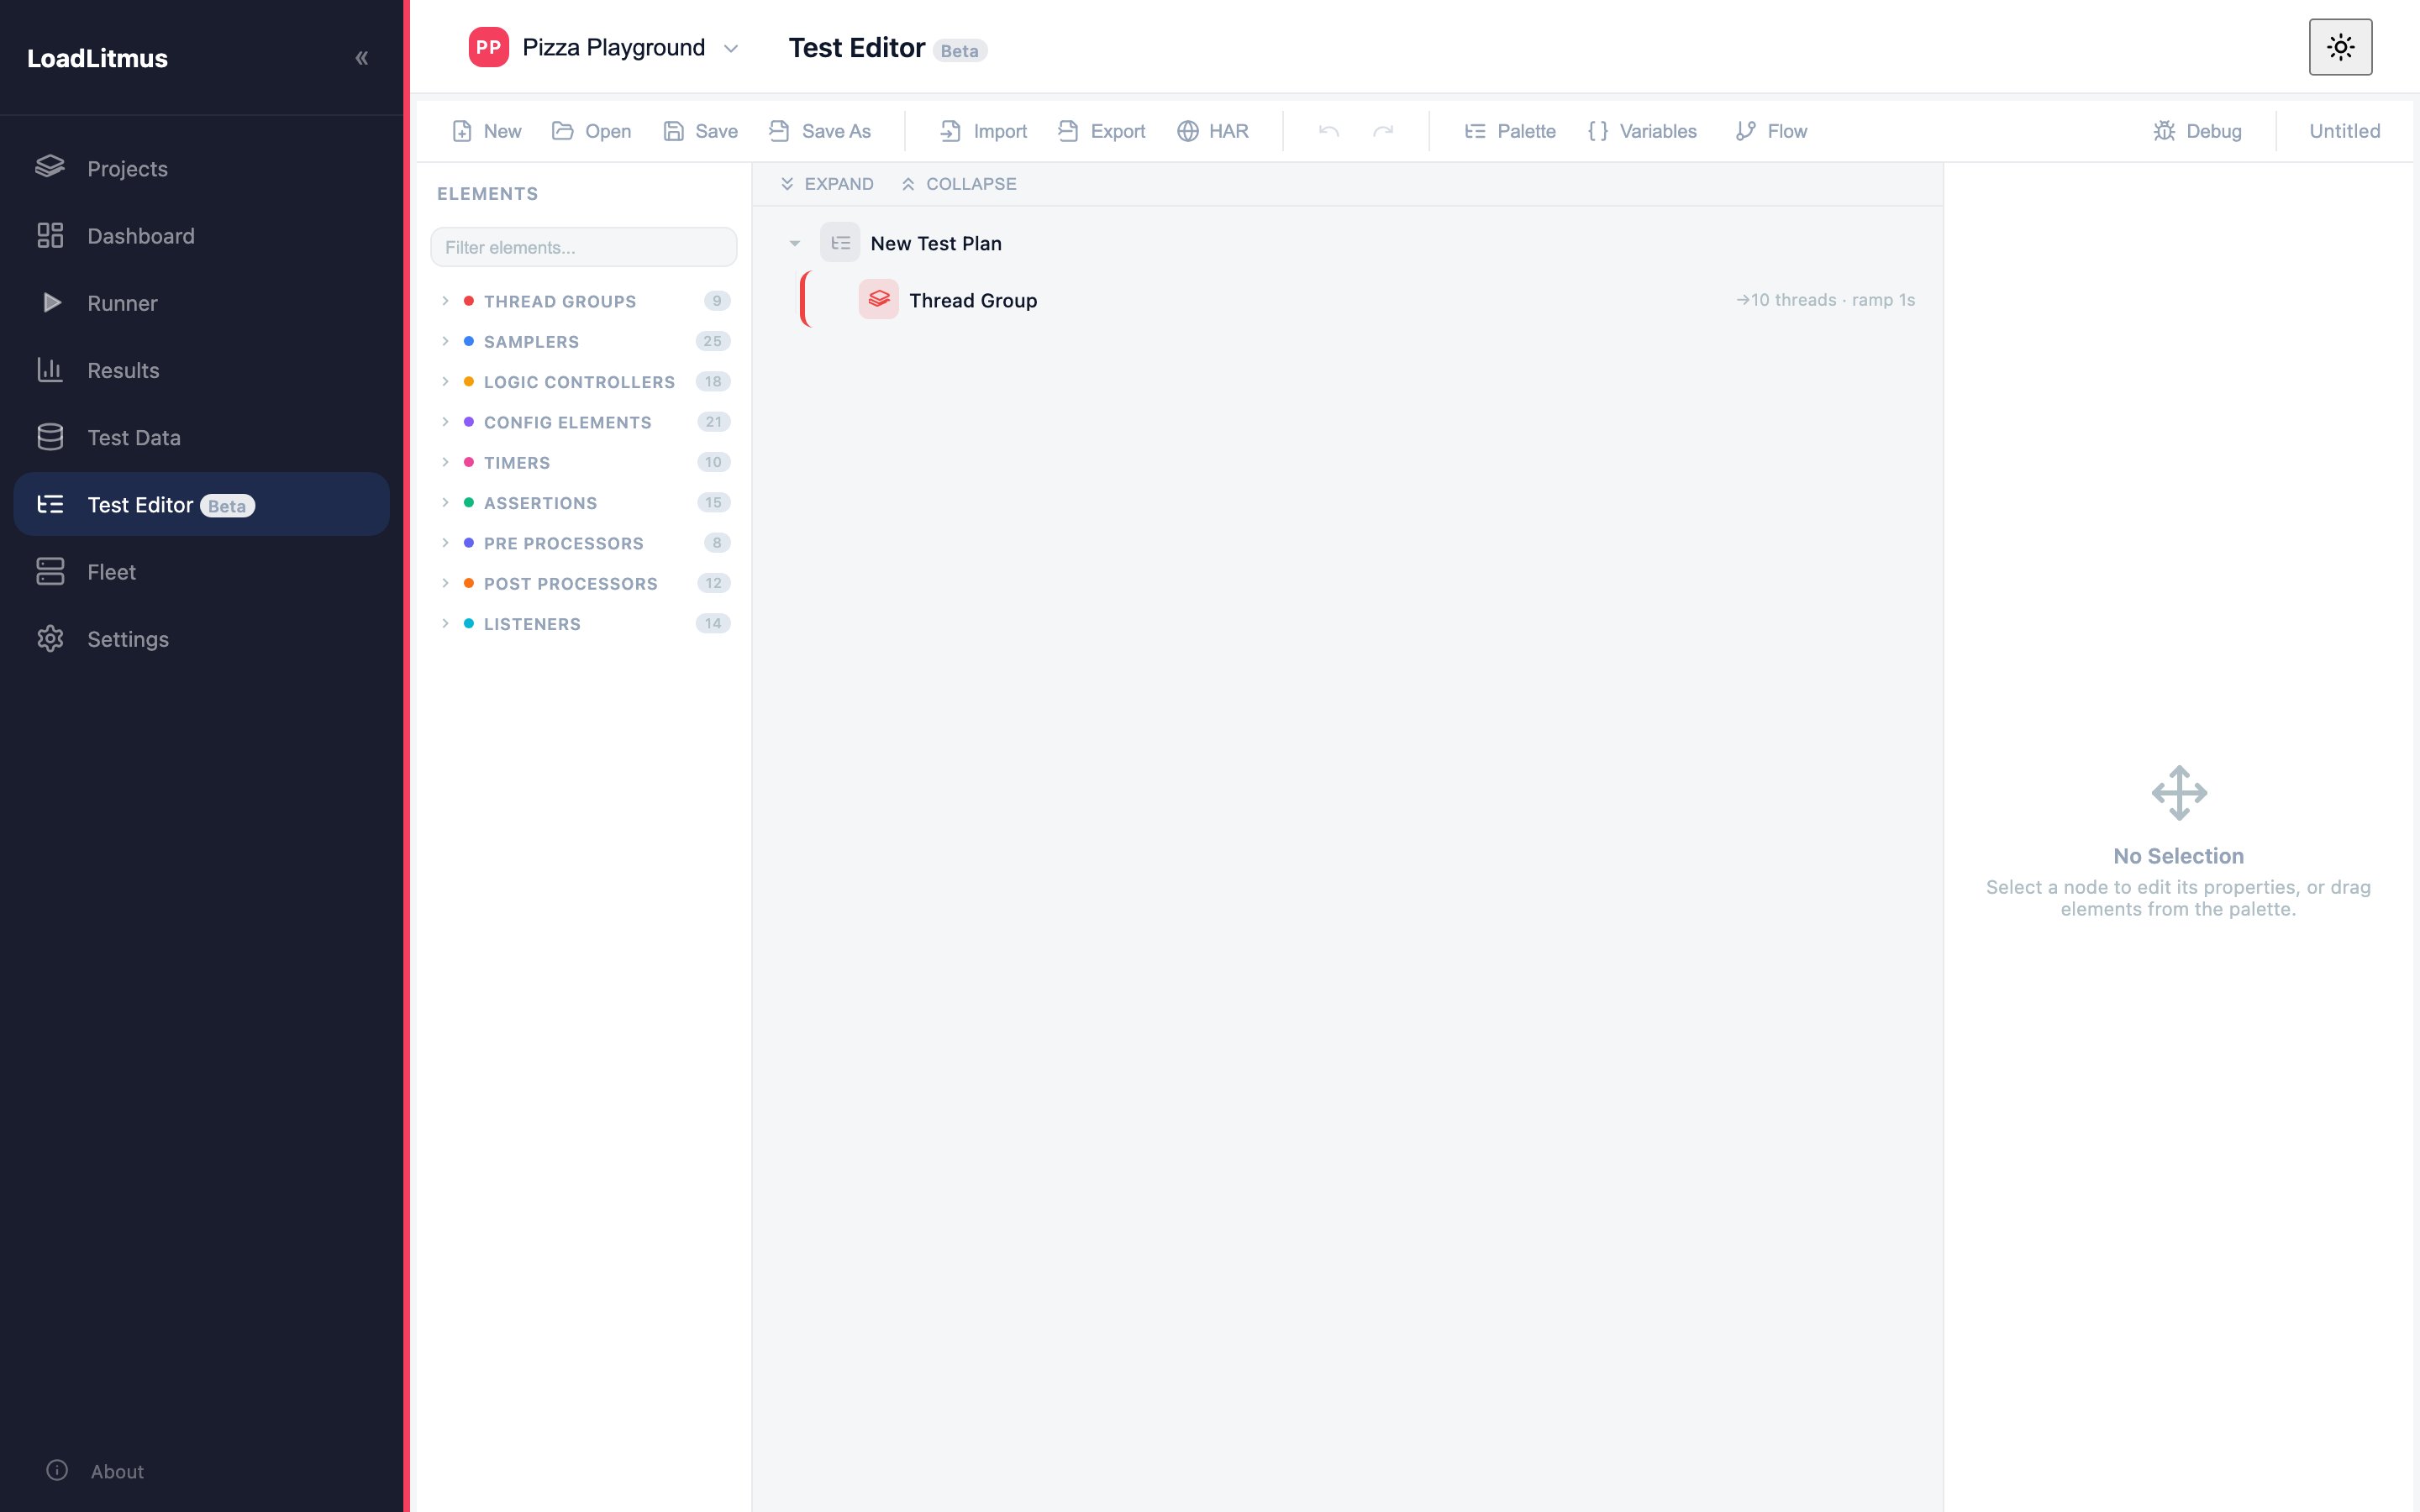
A visual editor for .jmx files: an element palette on the left, the plan tree in the middle, properties on the right. The toolbar has New, Open, Save, Save As, Import, Export, HAR, Palette, Variables, Flow and Debug. Open it to inspect a plan's structure.
More: Starter Script Template
Fleet
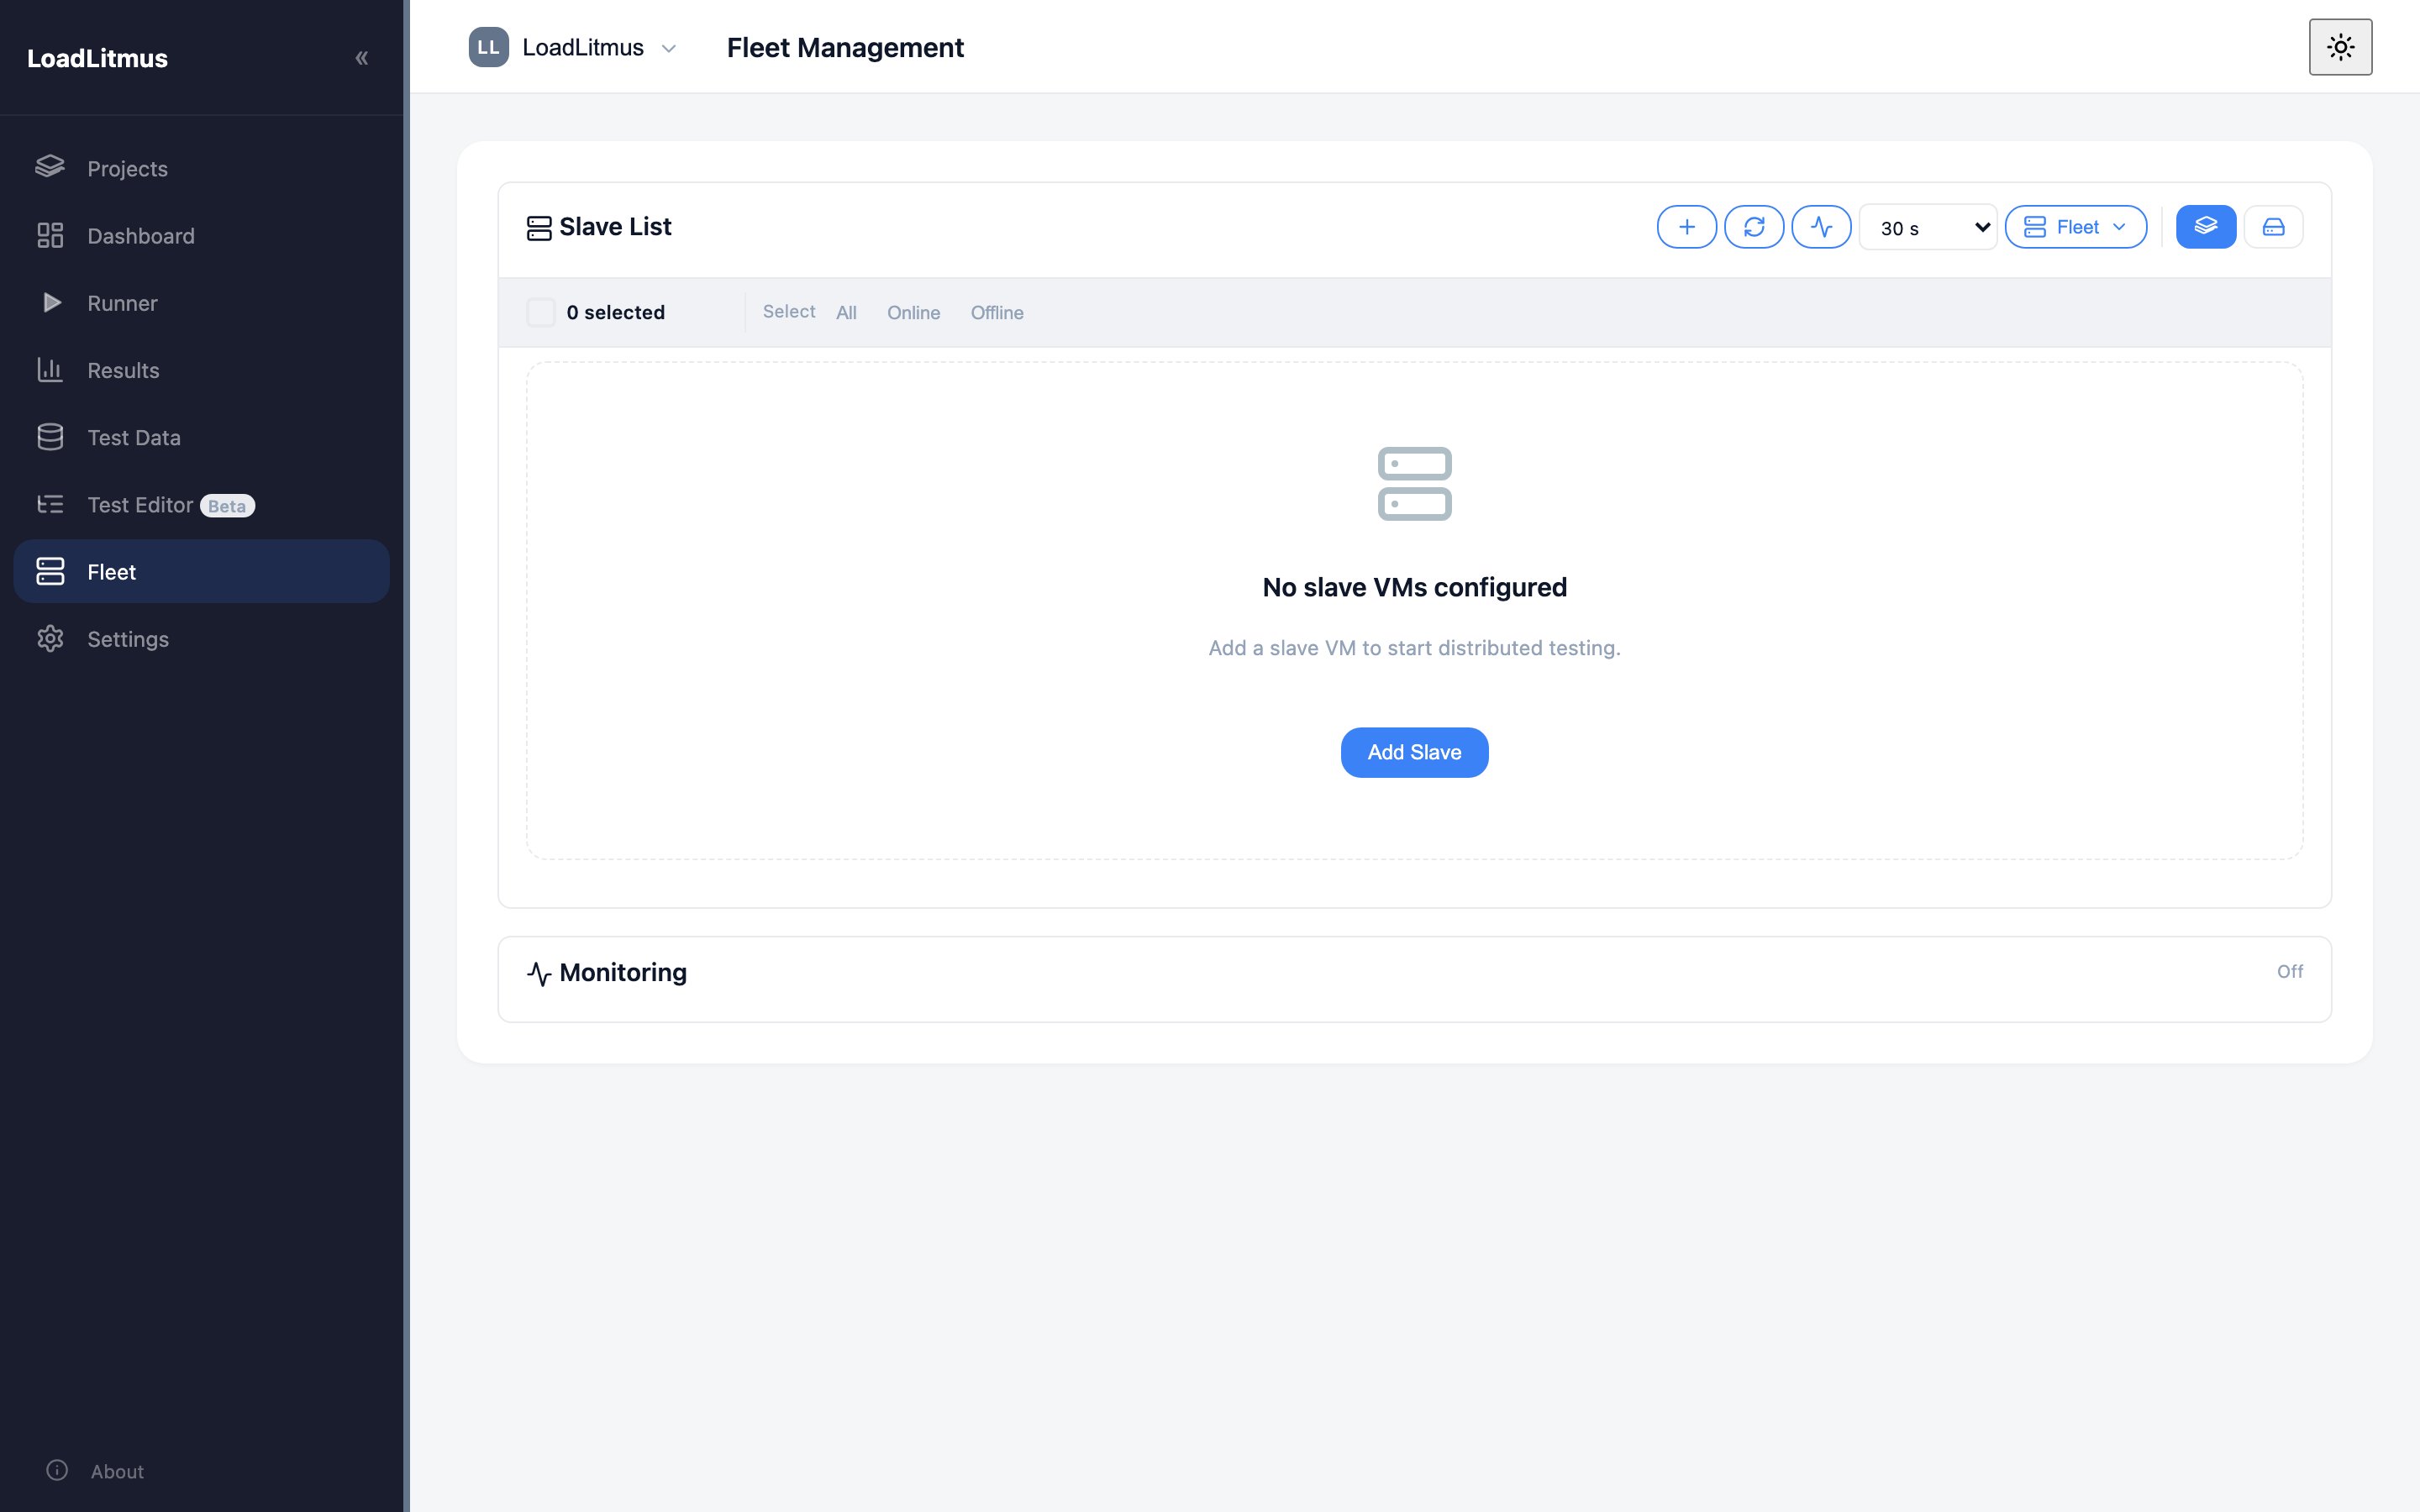
The slave machines used for distributed runs: add, check and provision them over SSH. A fresh install has none, as shown here. Fleet is shared across projects; each project then chooses which slaves it uses.
More: Fleet and Distributed Runs
Settings
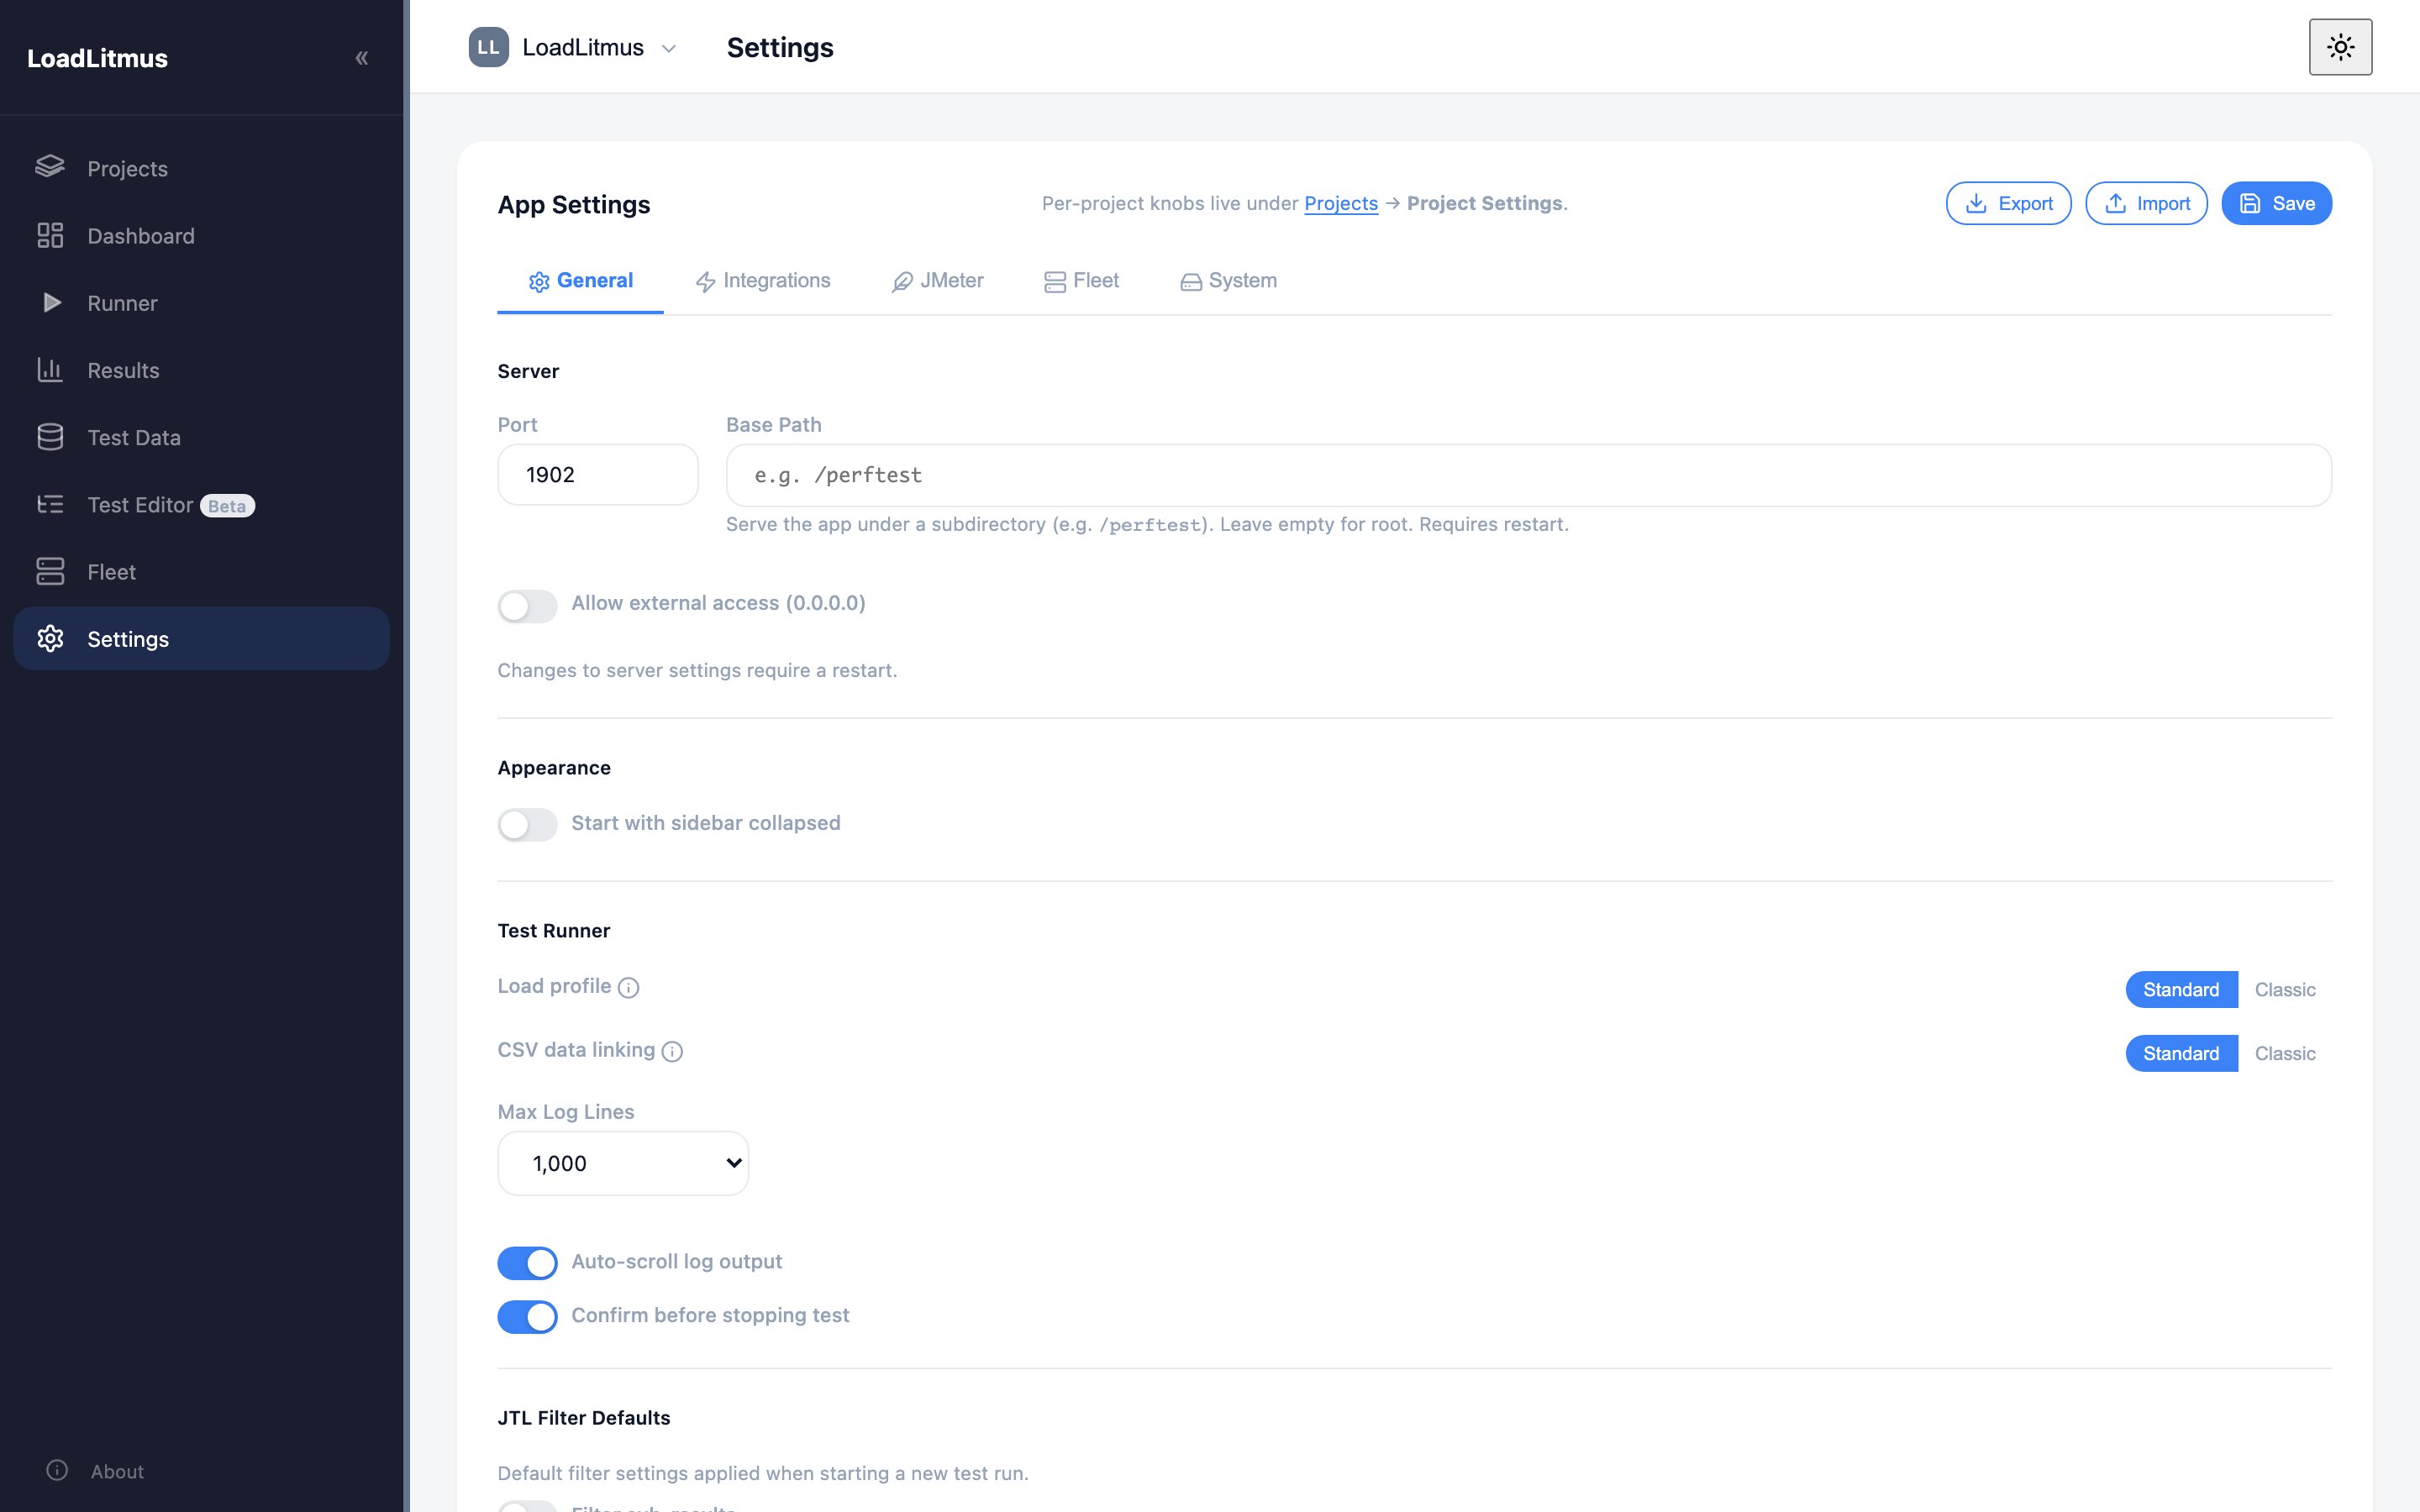
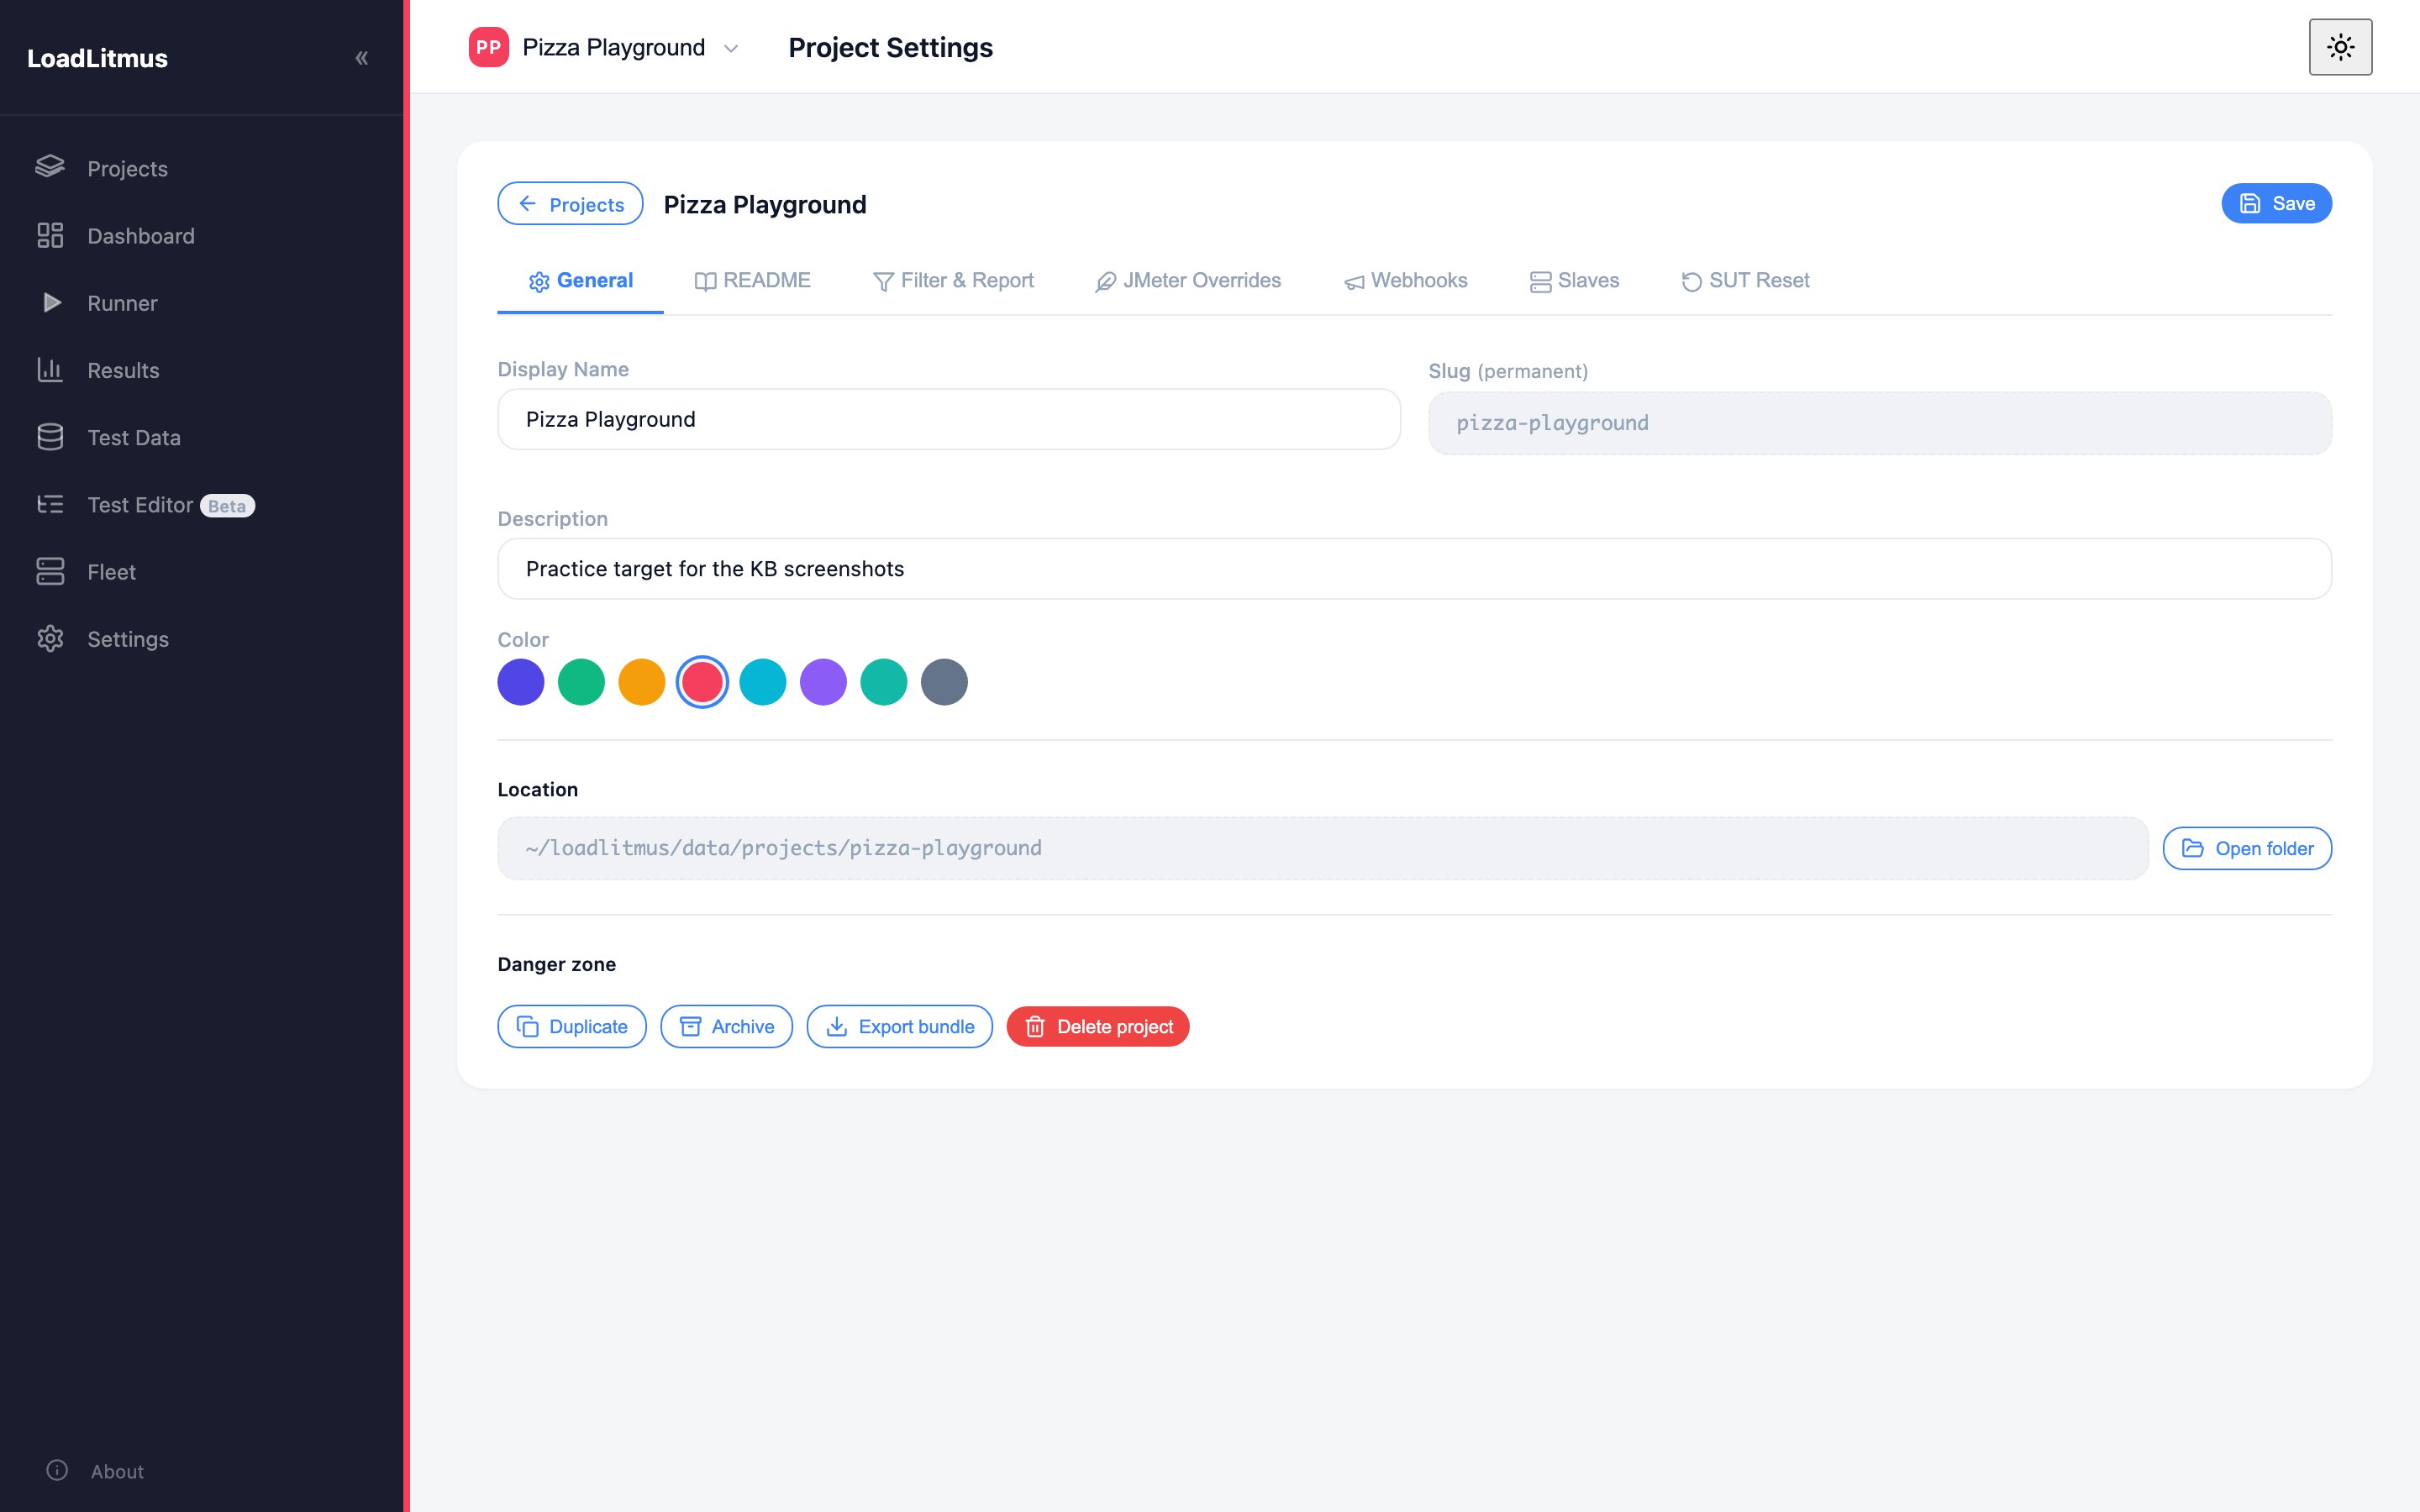
There are two levels of settings, and the sidebar item is only the first.
- Settings in the sidebar is App Settings, for the whole install: server port and external access, runner defaults, integrations, JMeter location, fleet defaults and system.
- Project Settings belong to one project: General, README, Filter & Report, JMeter Overrides, Webhooks, Slaves and SUT Reset. Reach them from the Projects page: open the project card's ... menu and choose Settings..., or click the card and use Settings in the README preview.
More: Install and First Project
About
Opens product information in a new tab. It is not part of the app's workflow, and the version it shows is not the one to trust. The running version is at /api/version.