Install and First Project
This page gets you from nothing to an empty project with a test plan in it. Budget ten minutes.
Why the install mode matters
LoadLitmus keeps everything on disk, so the first question is always where. It supports three modes, and the data folder differs in each:
| Mode | You get it from | Data folder |
|---|---|---|
| Installed (Windows) | .exe installer | %LOCALAPPDATA%\LoadLitmus\ |
| Installed (Linux) | .deb package | ~/.local/share/loadlitmus/ |
| Portable | .zip / .tar.gz | data\ next to the executable |
| Dev | the source repo | data/ in the repo root |
Installed and portable modes expect the data folder to exist already — the installer or the archive creates it. Only dev mode creates it on first run.
How: running from source
Use this when you are developing against it or trying it out.
pip install -r webapp/requirements.txt
python -m webapp
Then open http://127.0.0.1:1902. Useful variants:
python -m webapp --version            # prints the version
python -m webapp serve --port 9000    # different port
python -m webapp --host 0.0.0.0       # reachable from other machines
Python version: 3.11 or newer. macOS ships 3.9, so create a virtual environment first (
uv venv --python 3.12 .venv, orpython3 -m venv) or the install will fail on syntax it does not understand.
JMeter is optional at this point. Without it you can still browse projects, read results and use the editor; you just cannot run a test. LoadLitmus finds a system JMeter (on macOS, a Homebrew one works), or you can point it at a path in App Settings → JMeter. The installers can also bundle a JRE and JMeter so a client machine needs nothing installed.
How: creating a project
- Open Projects in the sidebar, press New project.
- Give it the system's name — "Student Portal", not "load test".
- Pick a colour. The two-letter monogram in the header comes from the name.
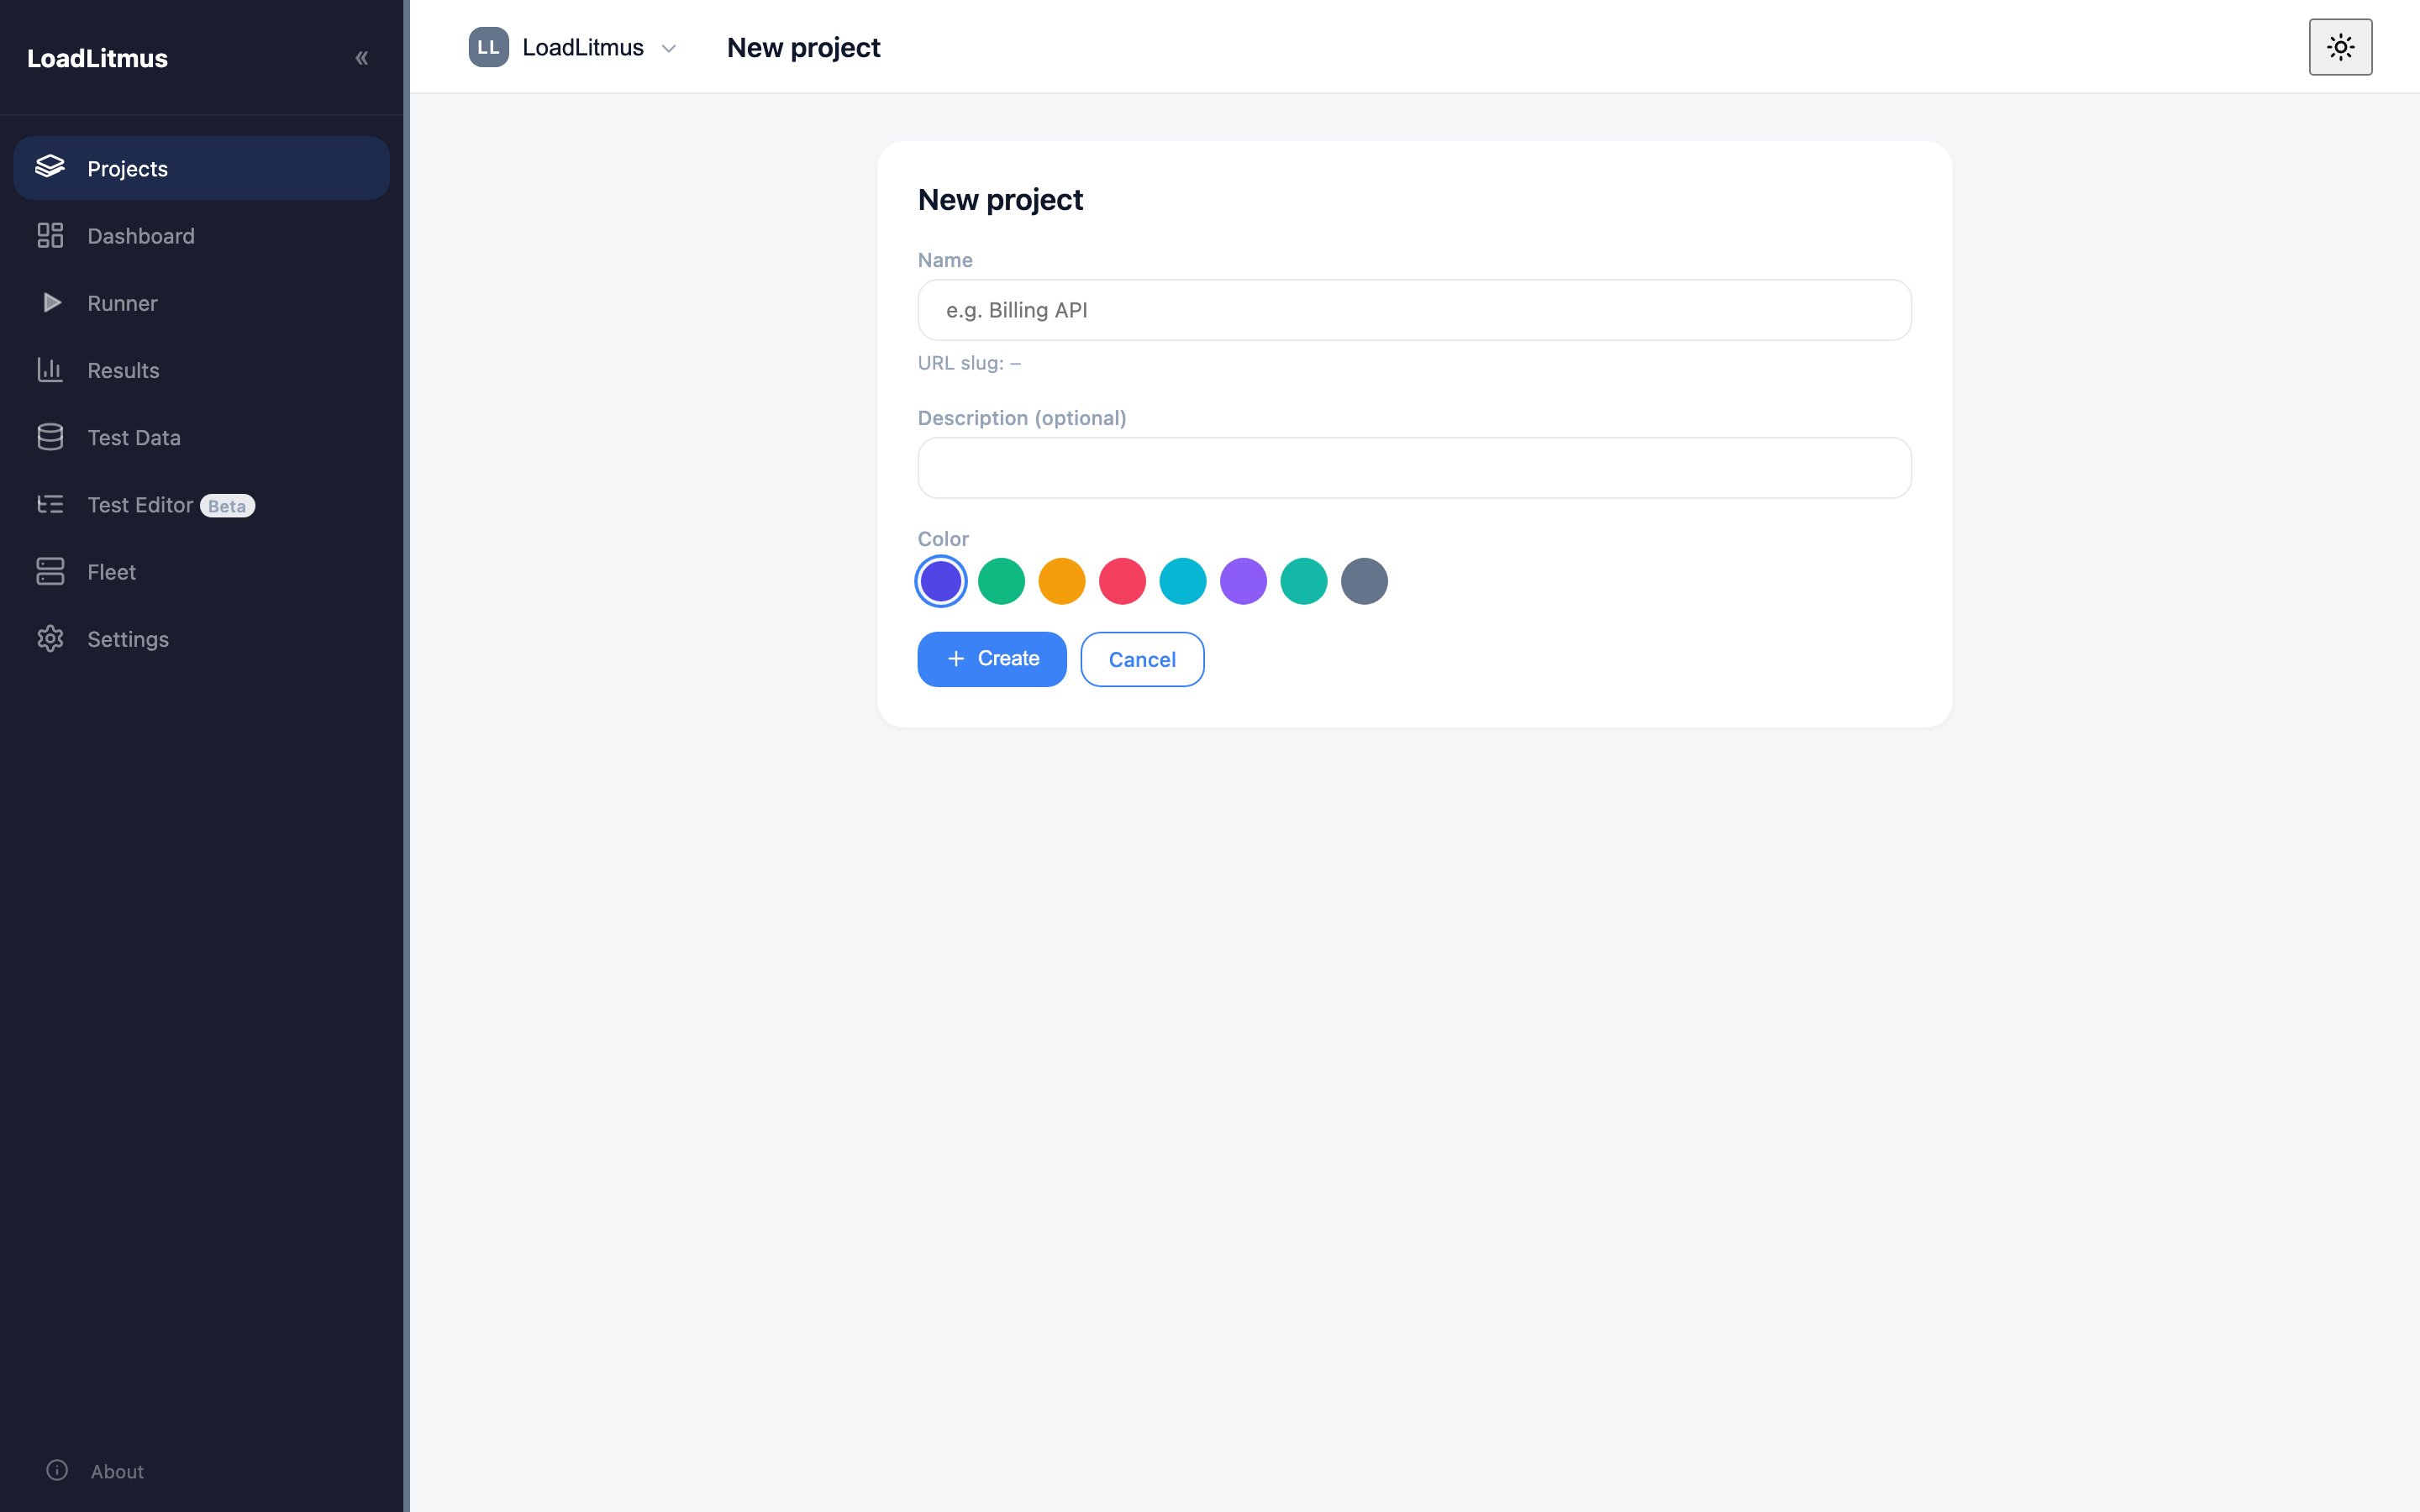
That creates data/projects/<slug>/ with four folders:
data/projects/um-portal/
├── test_plan/     ← .jmx files
├── test_data/     ← .csv files
├── results/       ← one folder per run; this IS the run history
└── config/        ← per-project configuration
The slug (um-portal) is permanent and appears in every URL, so name the project properly the first time. Renaming later changes the display name, not the slug.
Then put your script in:
- Drop a
.jmxintotest_plan/directly, or - Use the upload button on the Runner page, or
- Build one in the Test Editor.
Any CSV the script reads goes into test_data/. See Script Requirements for the path pattern that keeps CSVs working on slaves too.
Settings worth setting once
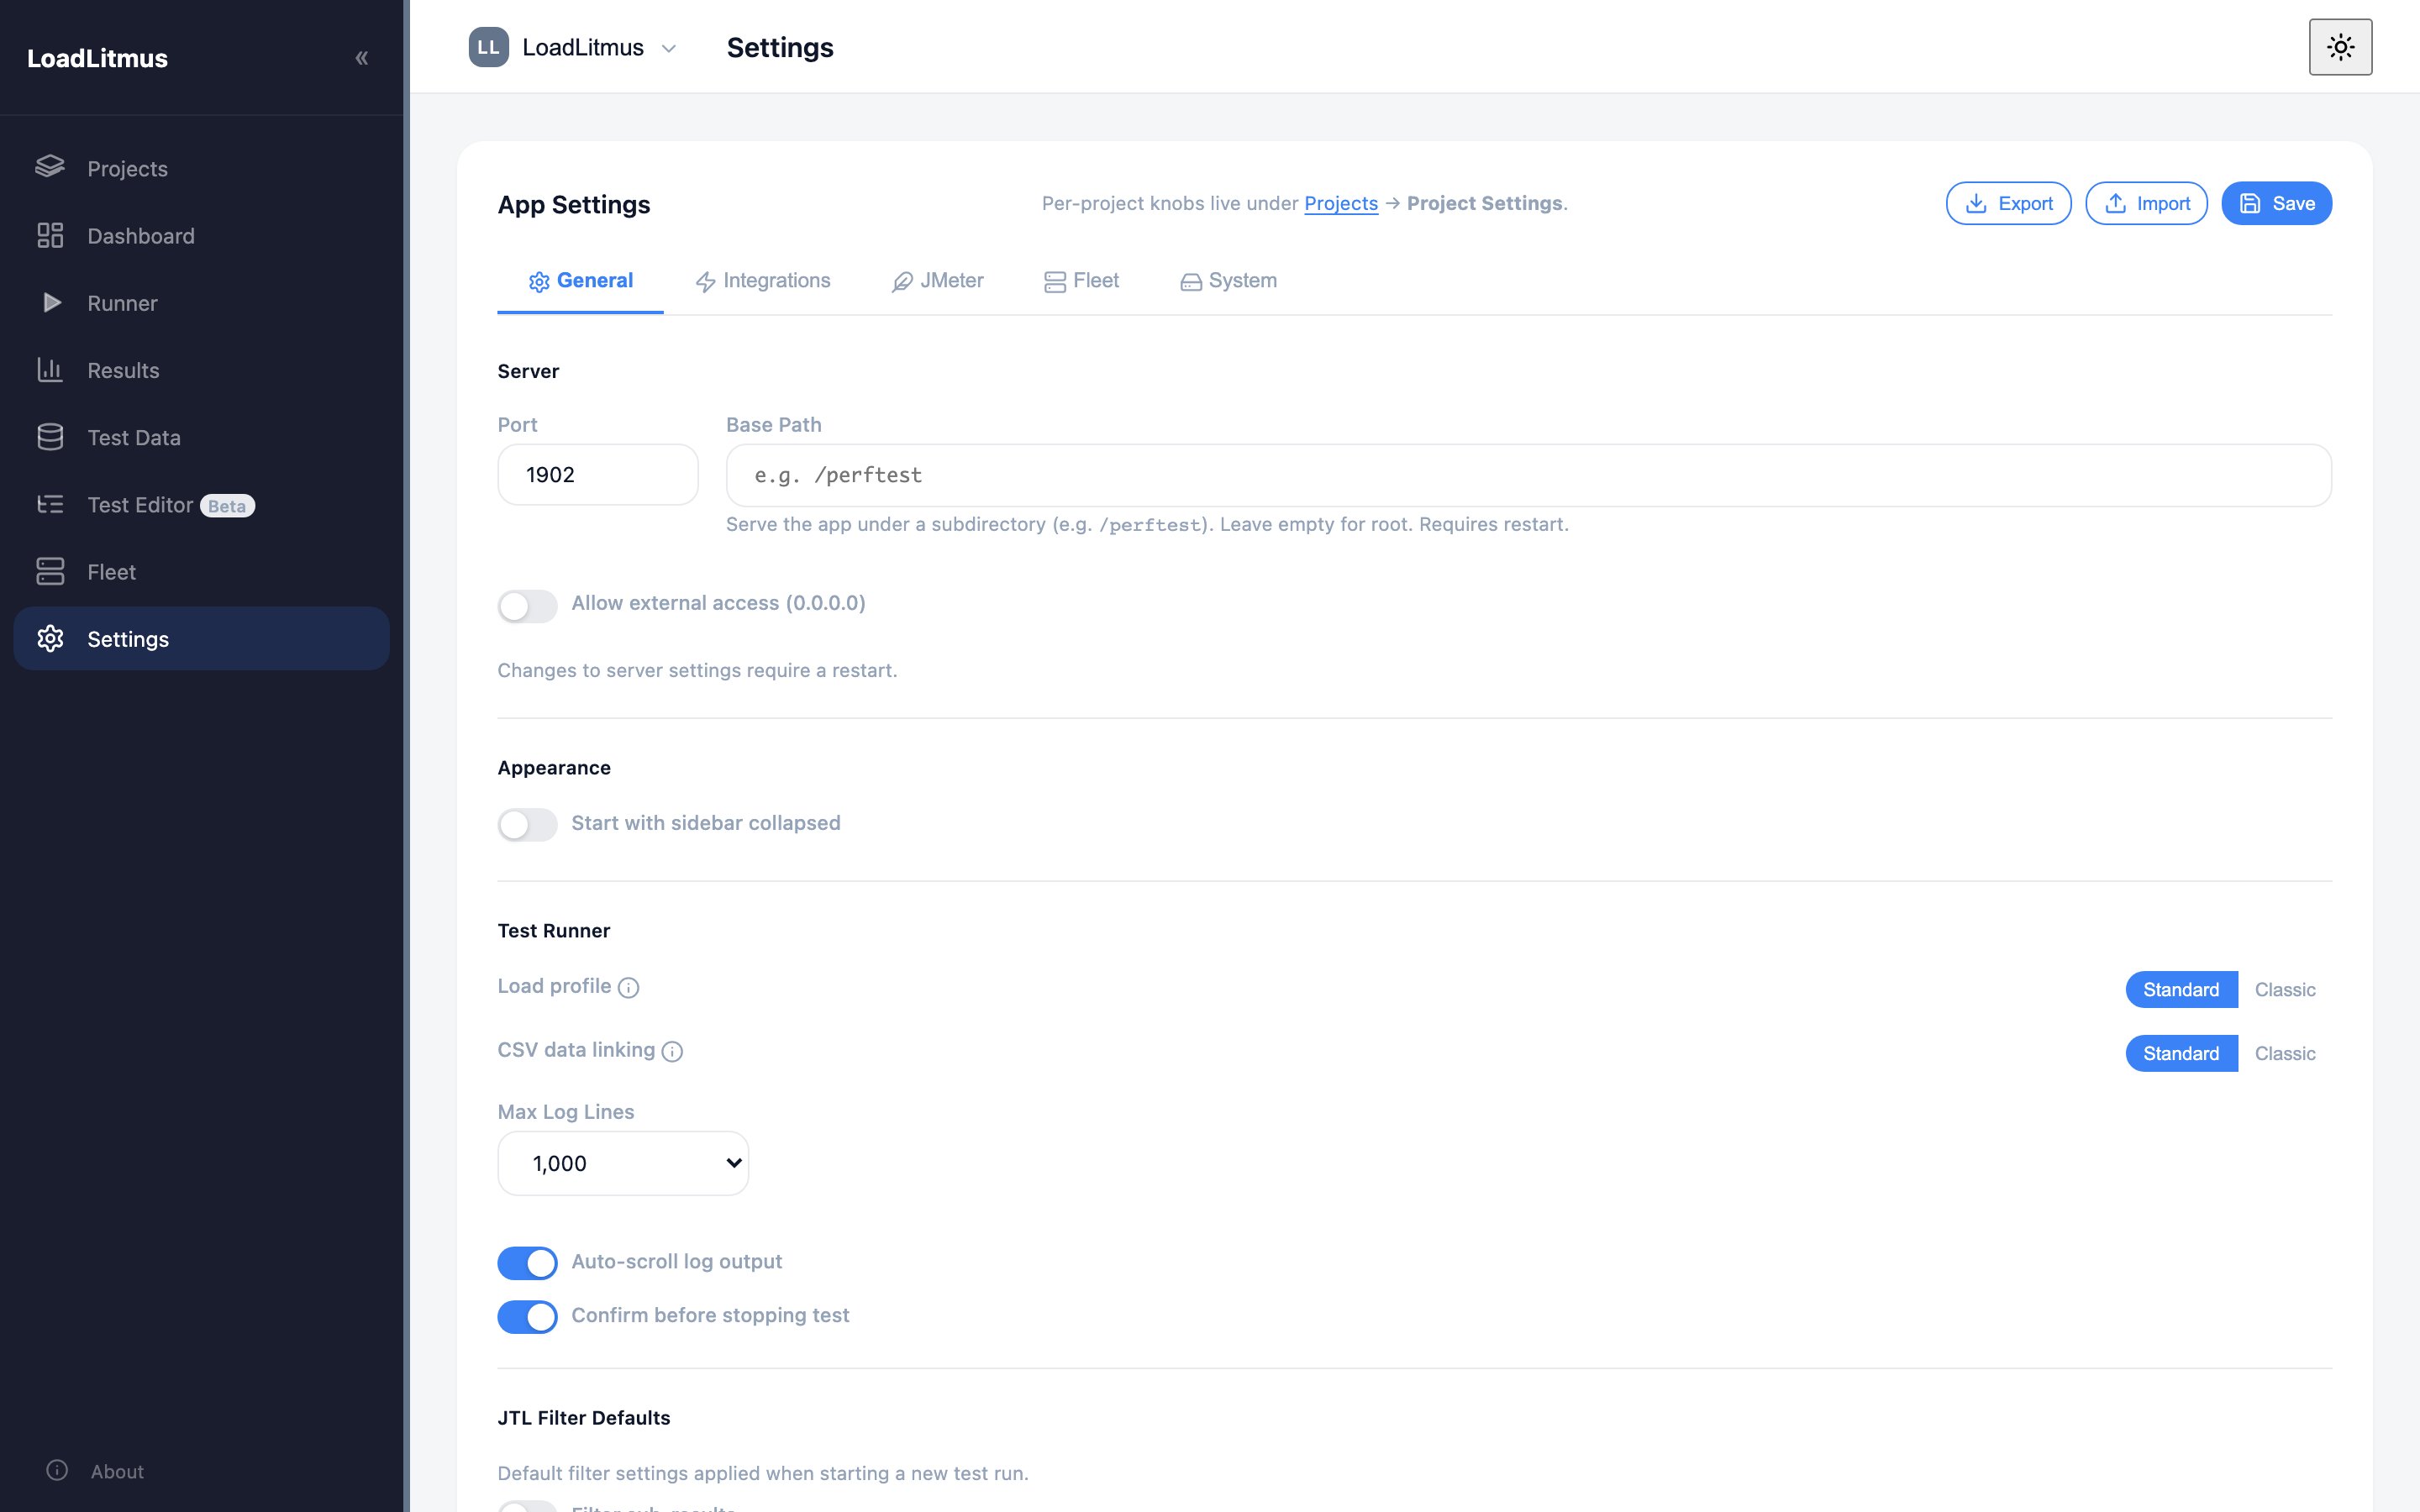
Settings are split across two pages:
- App Settings (Settings in the sidebar, tabs General, Integrations, JMeter, Fleet, System): port, external access, JMeter path and properties, fleet SSH defaults, integrations. It covers the whole install.
- Project Settings (a separate page per project): filter and report options, JMeter overrides, webhooks, slaves, SUT reset. Reach it from the Projects page: the card's ... menu, then Settings....
Set these on day one:
| Setting | Where | Why |
|---|---|---|
| JMeter path | App Settings → JMeter | Nothing runs without it |
| InfluxDB URL, token, org | App Settings → Integrations | Turns on live monitoring for every project; see Results and Monitoring |
| Webhooks | Project Settings → Webhooks | Slack/Teams message when a run finishes |
| Allow external access | App Settings → General | Only if colleagues need to watch; read the access rules below first |
Ports and access
| Port | What | Notes |
|---|---|---|
| 1902 | The web UI | Binds 127.0.0.1 unless you allow external access |
| 4445 | JMeter shutdown listener (UDP) | How the Stop buttons talk to JMeter |
| 1099, 50000 | JMeter RMI to slaves | Distributed runs only |
| 9100 | Slave metrics agent | Fleet health charts |
| 8866 | Proxy recorder | Always localhost only, by design — it has no auth |
Access control is simple and has no user accounts:
- Localhost is admin. Whoever is on the machine can do everything.
- Remote users are read-only, unless they enter the token at
/token, which makes them admin too.
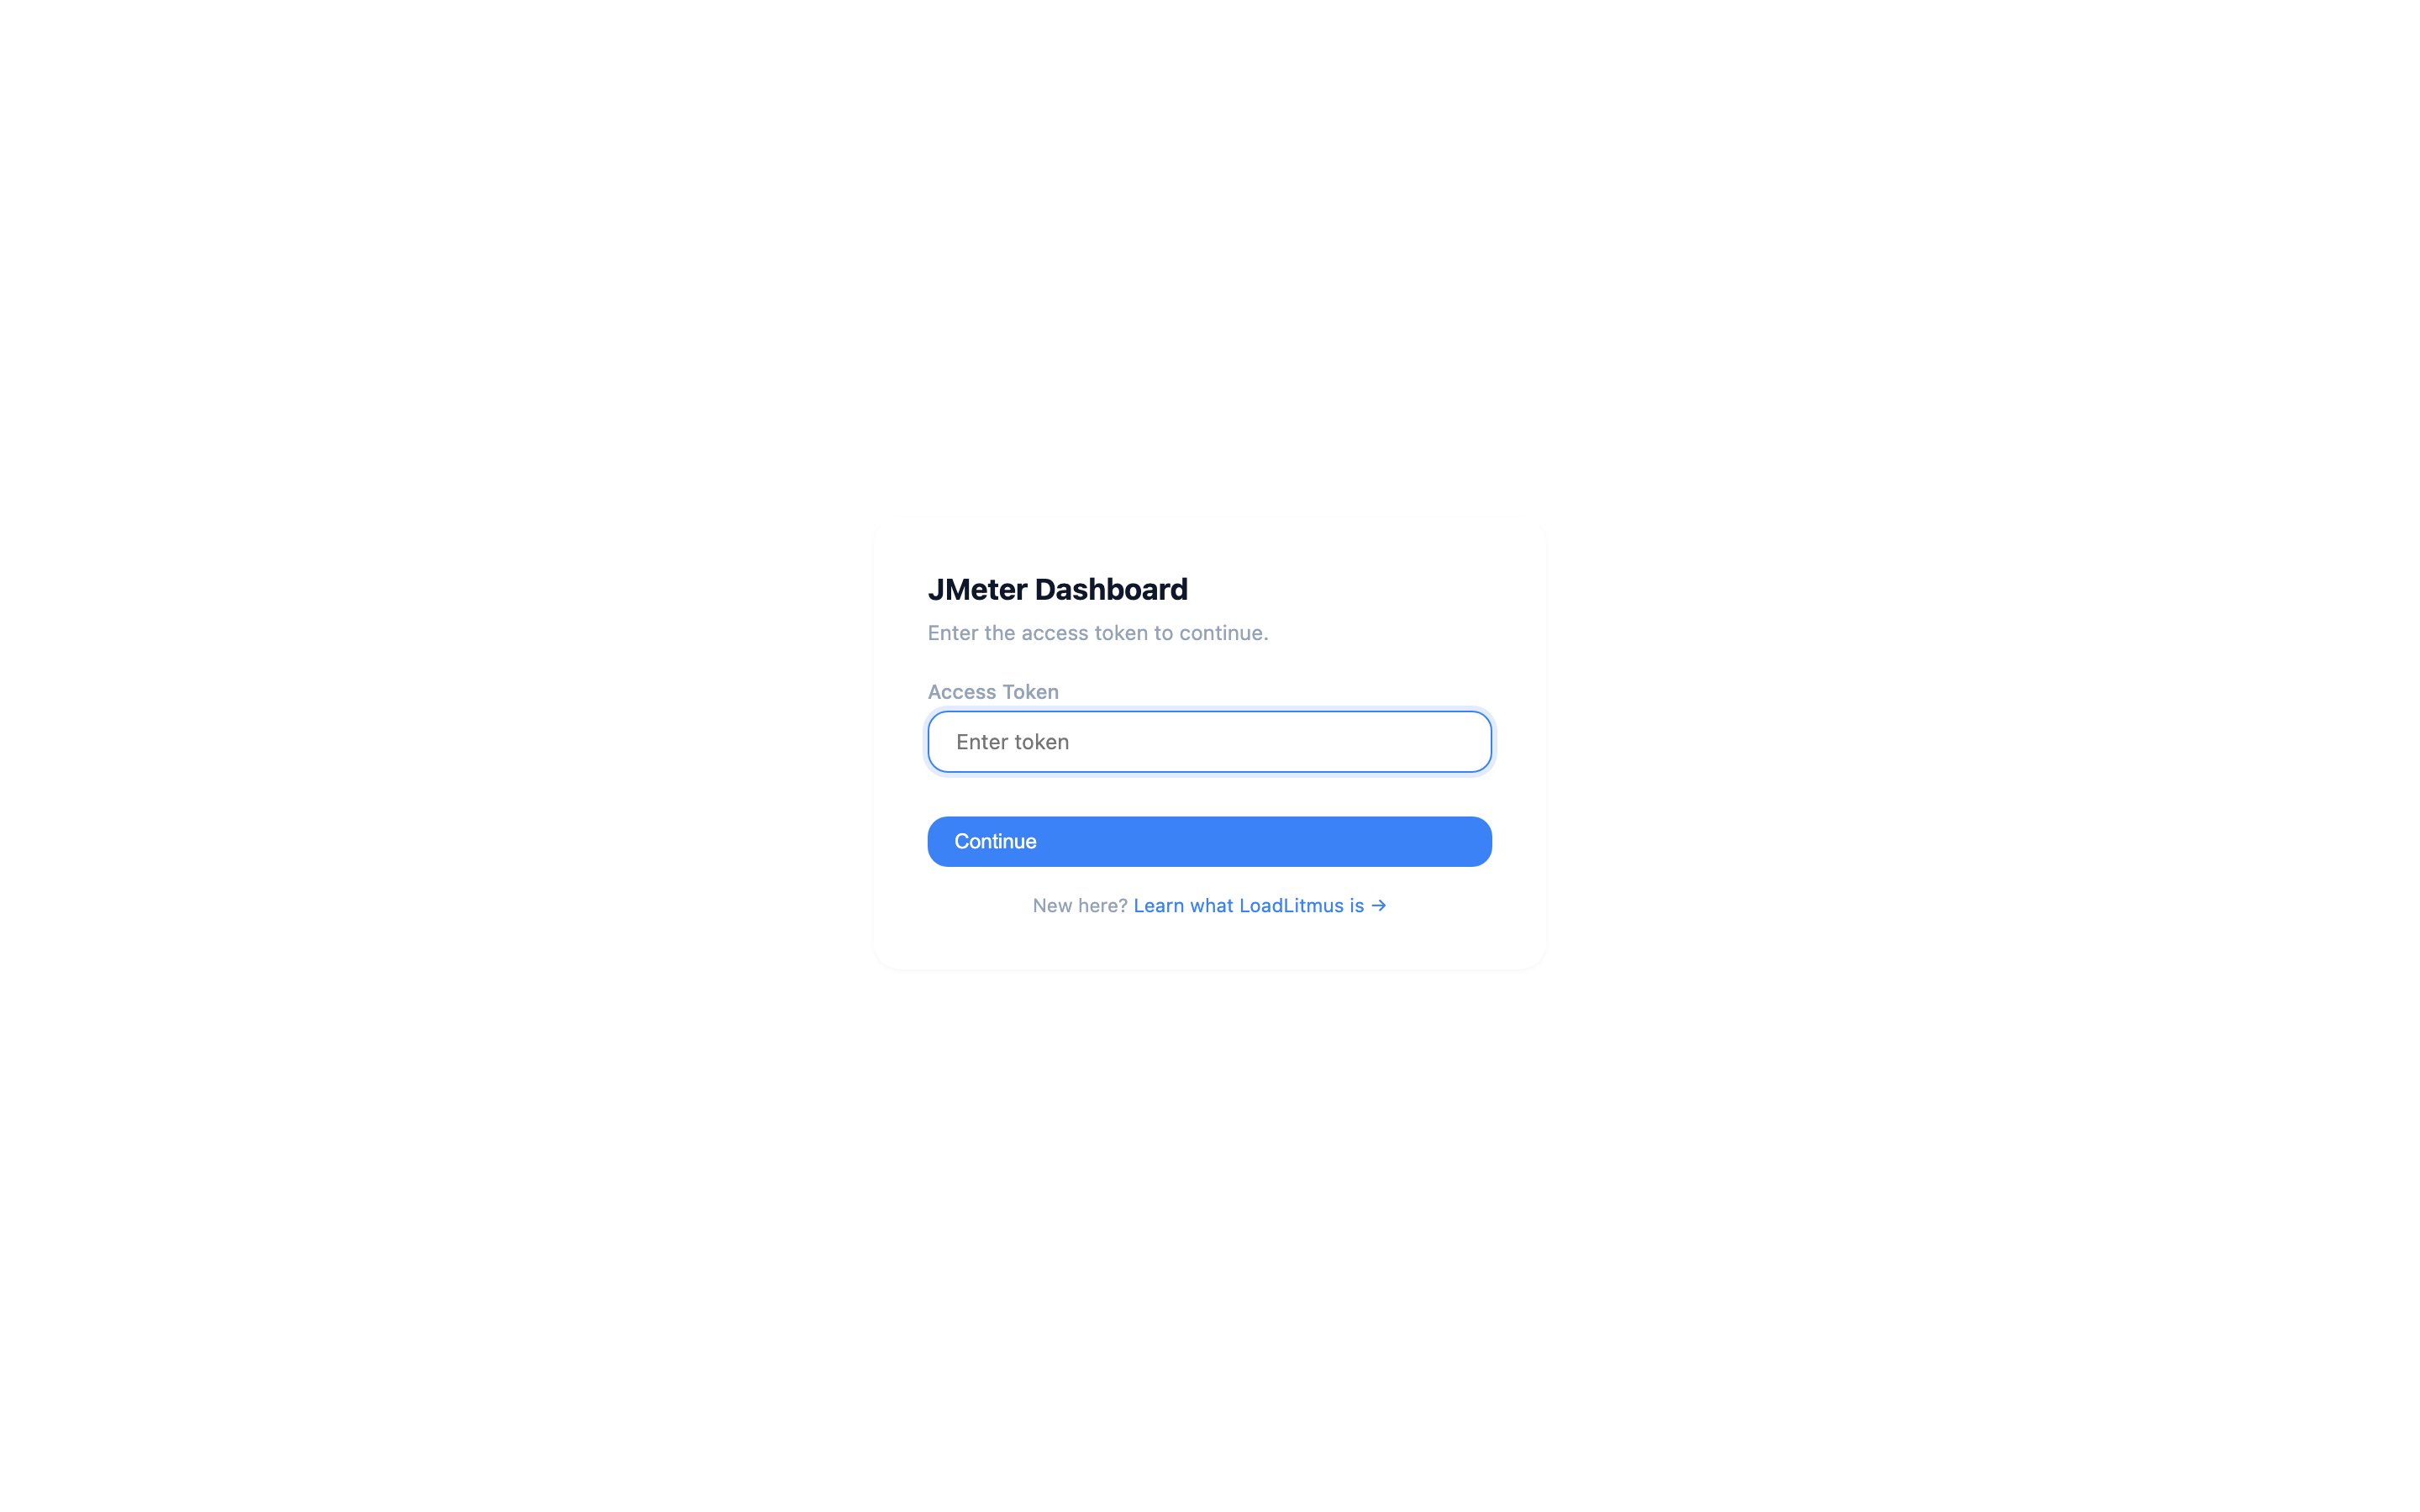
So "allow external access" means: anyone who can reach the port can read your results, and anyone with the token can start tests. On a client network, keep it on localhost and share results as exported reports instead.
Tips
- Back up
data/, nothing else. It contains every project, plan, CSV and result. There is no database to dump. - One instance runs one test at a time. Starting a second run while one is active either queues or is refused, depending on the option you pick. Plan around it when several people share a test server.
- Check
/api/healthwhen something feels wrong. It reports the version, whether JMeter was detected, disk space and whether a run is active.