Results and Monitoring
A run that nobody can read is a run you have to do again. LoadLitmus keeps every result in the project and gives you four ways to read it: the results list, the JMeter HTML report, a comparison between two runs, and an exported document for the client.
The results list
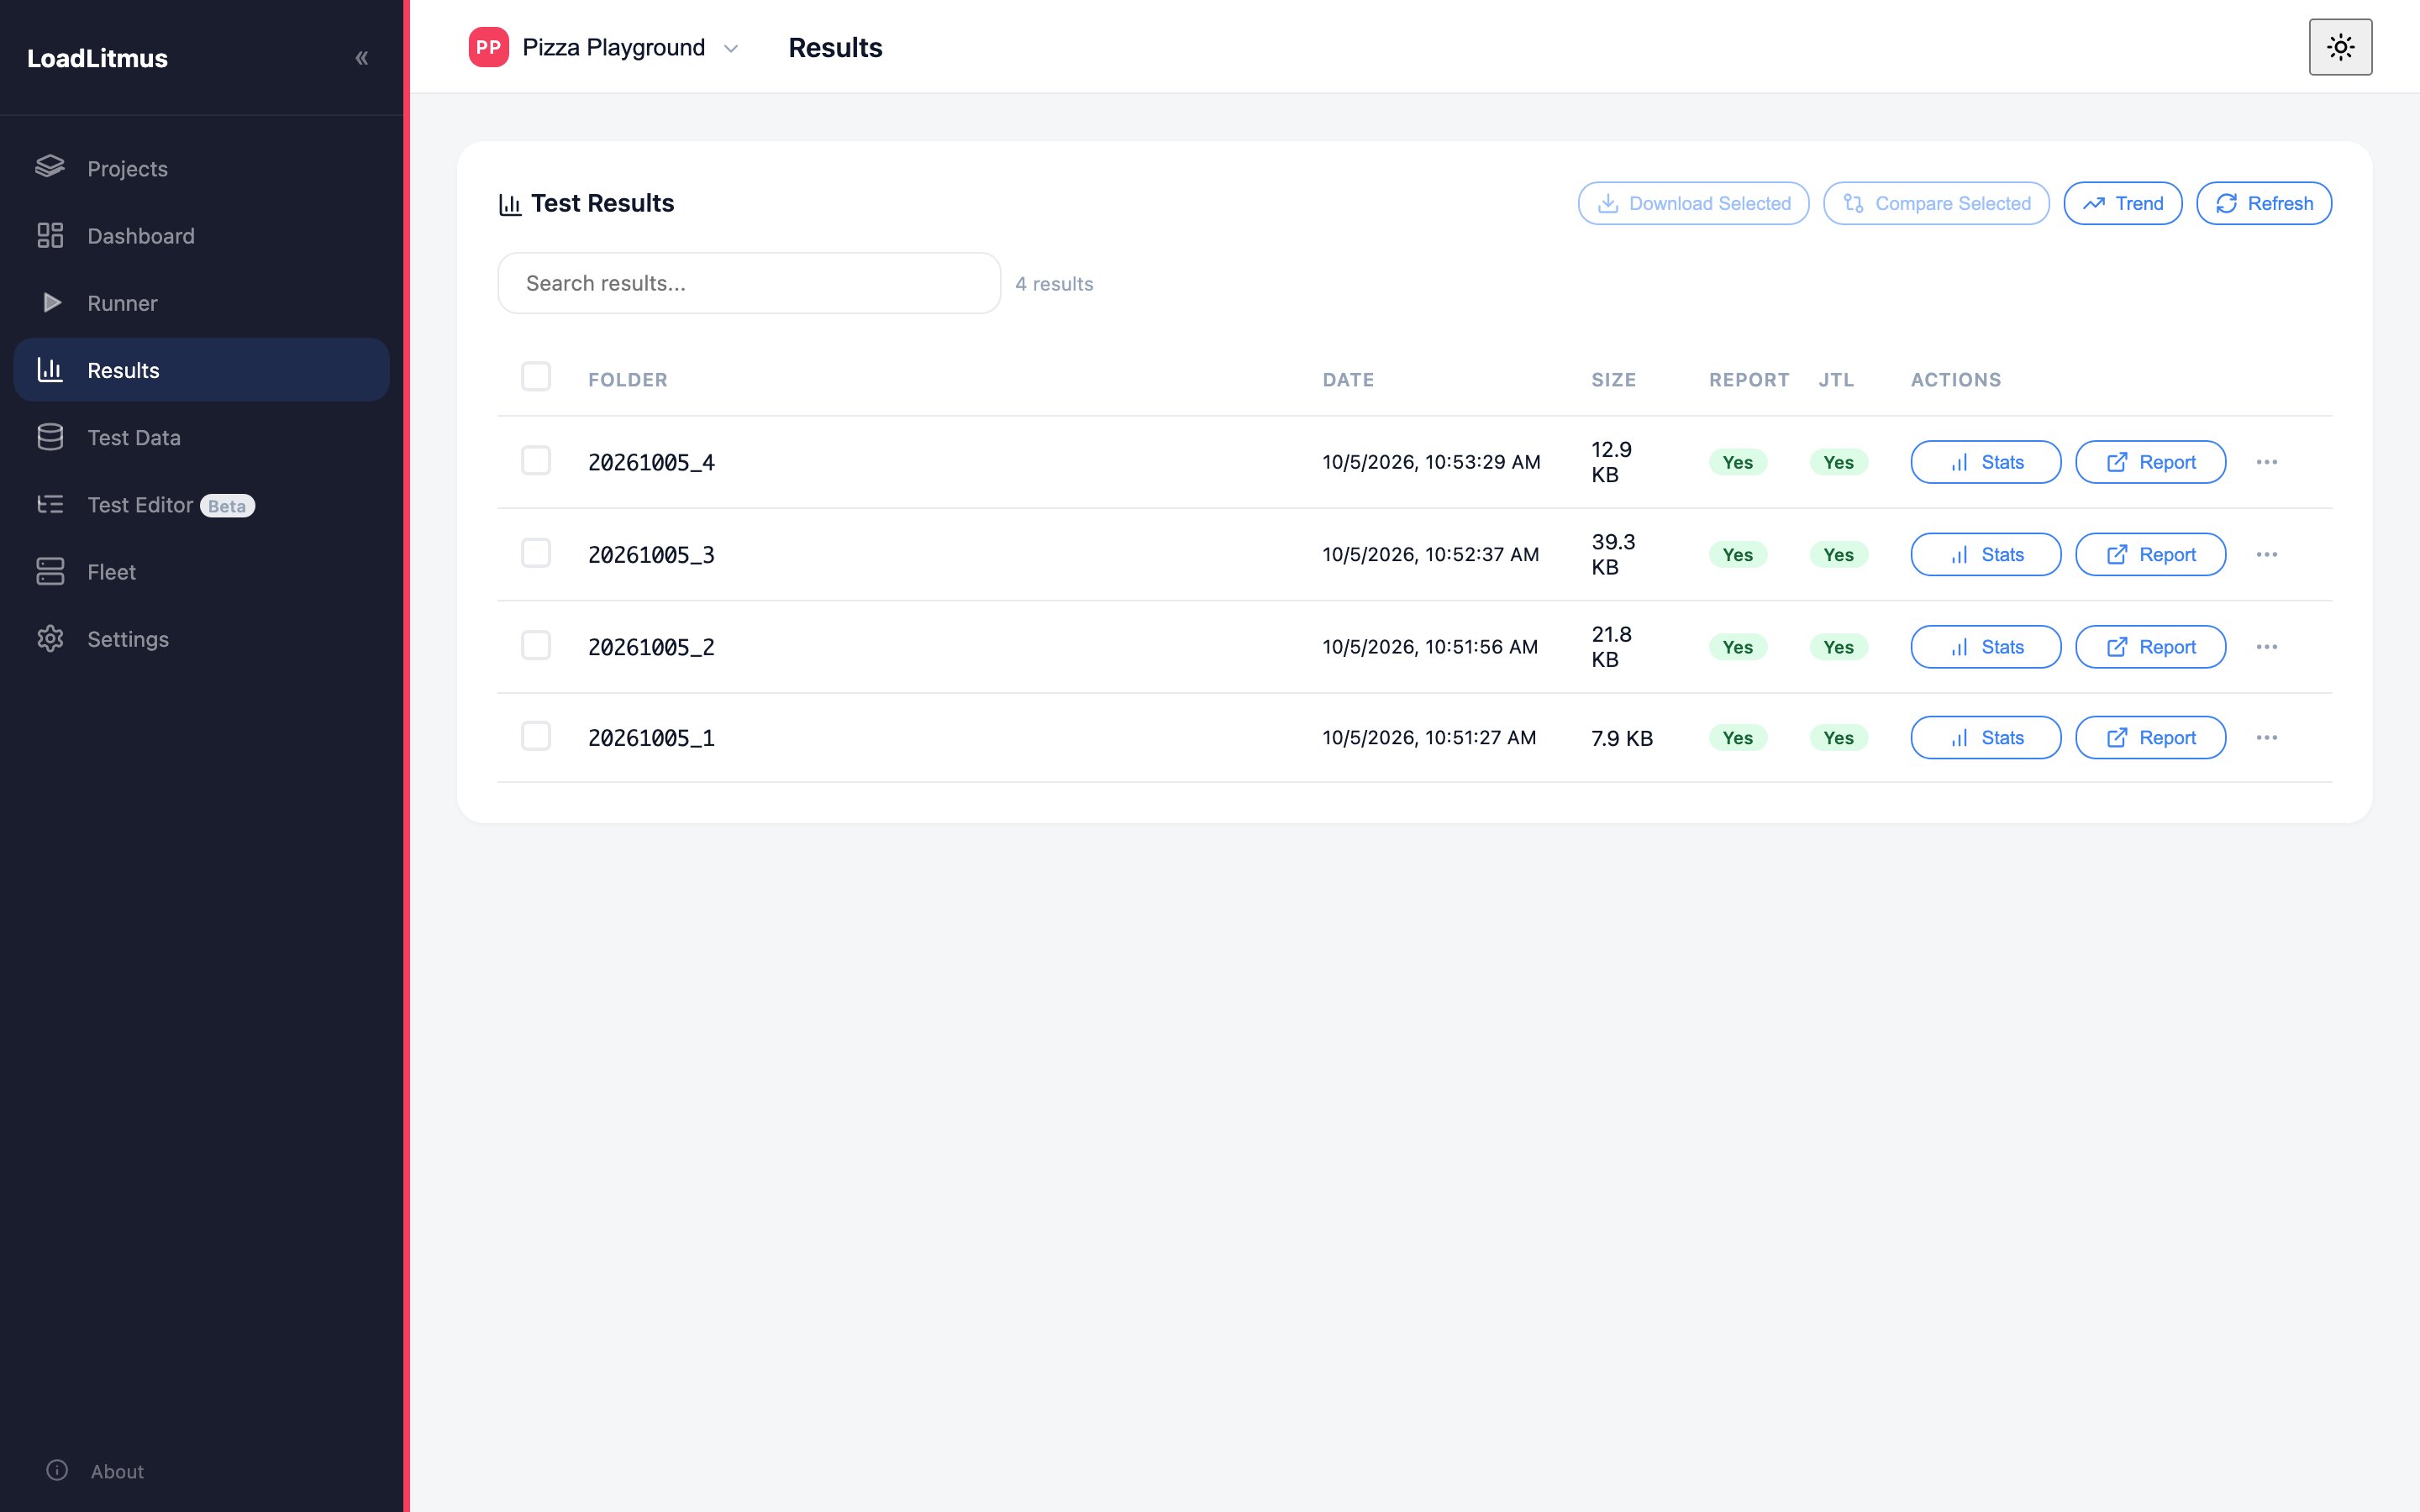
One row per run, newest first:
| Column | What it tells you |
|---|---|
| Folder | The result folder, named by date and sequence (20261005_4) |
| Date / Size | When it ran, how much data it produced |
| Report / JTL | Whether the HTML report and the raw JTL exist |
| Actions | Stats, Report, and a menu for downloads, exports and delete |
Stats is the quickest signal in the whole app: it shows throughput, average response time and error rate for a run, and the error rate is tinted red when it is above zero. A run pointed at a port with nothing listening shows 100% errors, which is exactly what a system-down run looks like.
Per-row actions: open the report, open the folder (on the machine itself), download, delete, and Stats for the quick numbers without leaving the page.
Reading a report
The Report button opens JMeter's own HTML dashboard for that run: summary table, response times over time, throughput, percentiles, error breakdown. It is generated after the run, from the JTL.
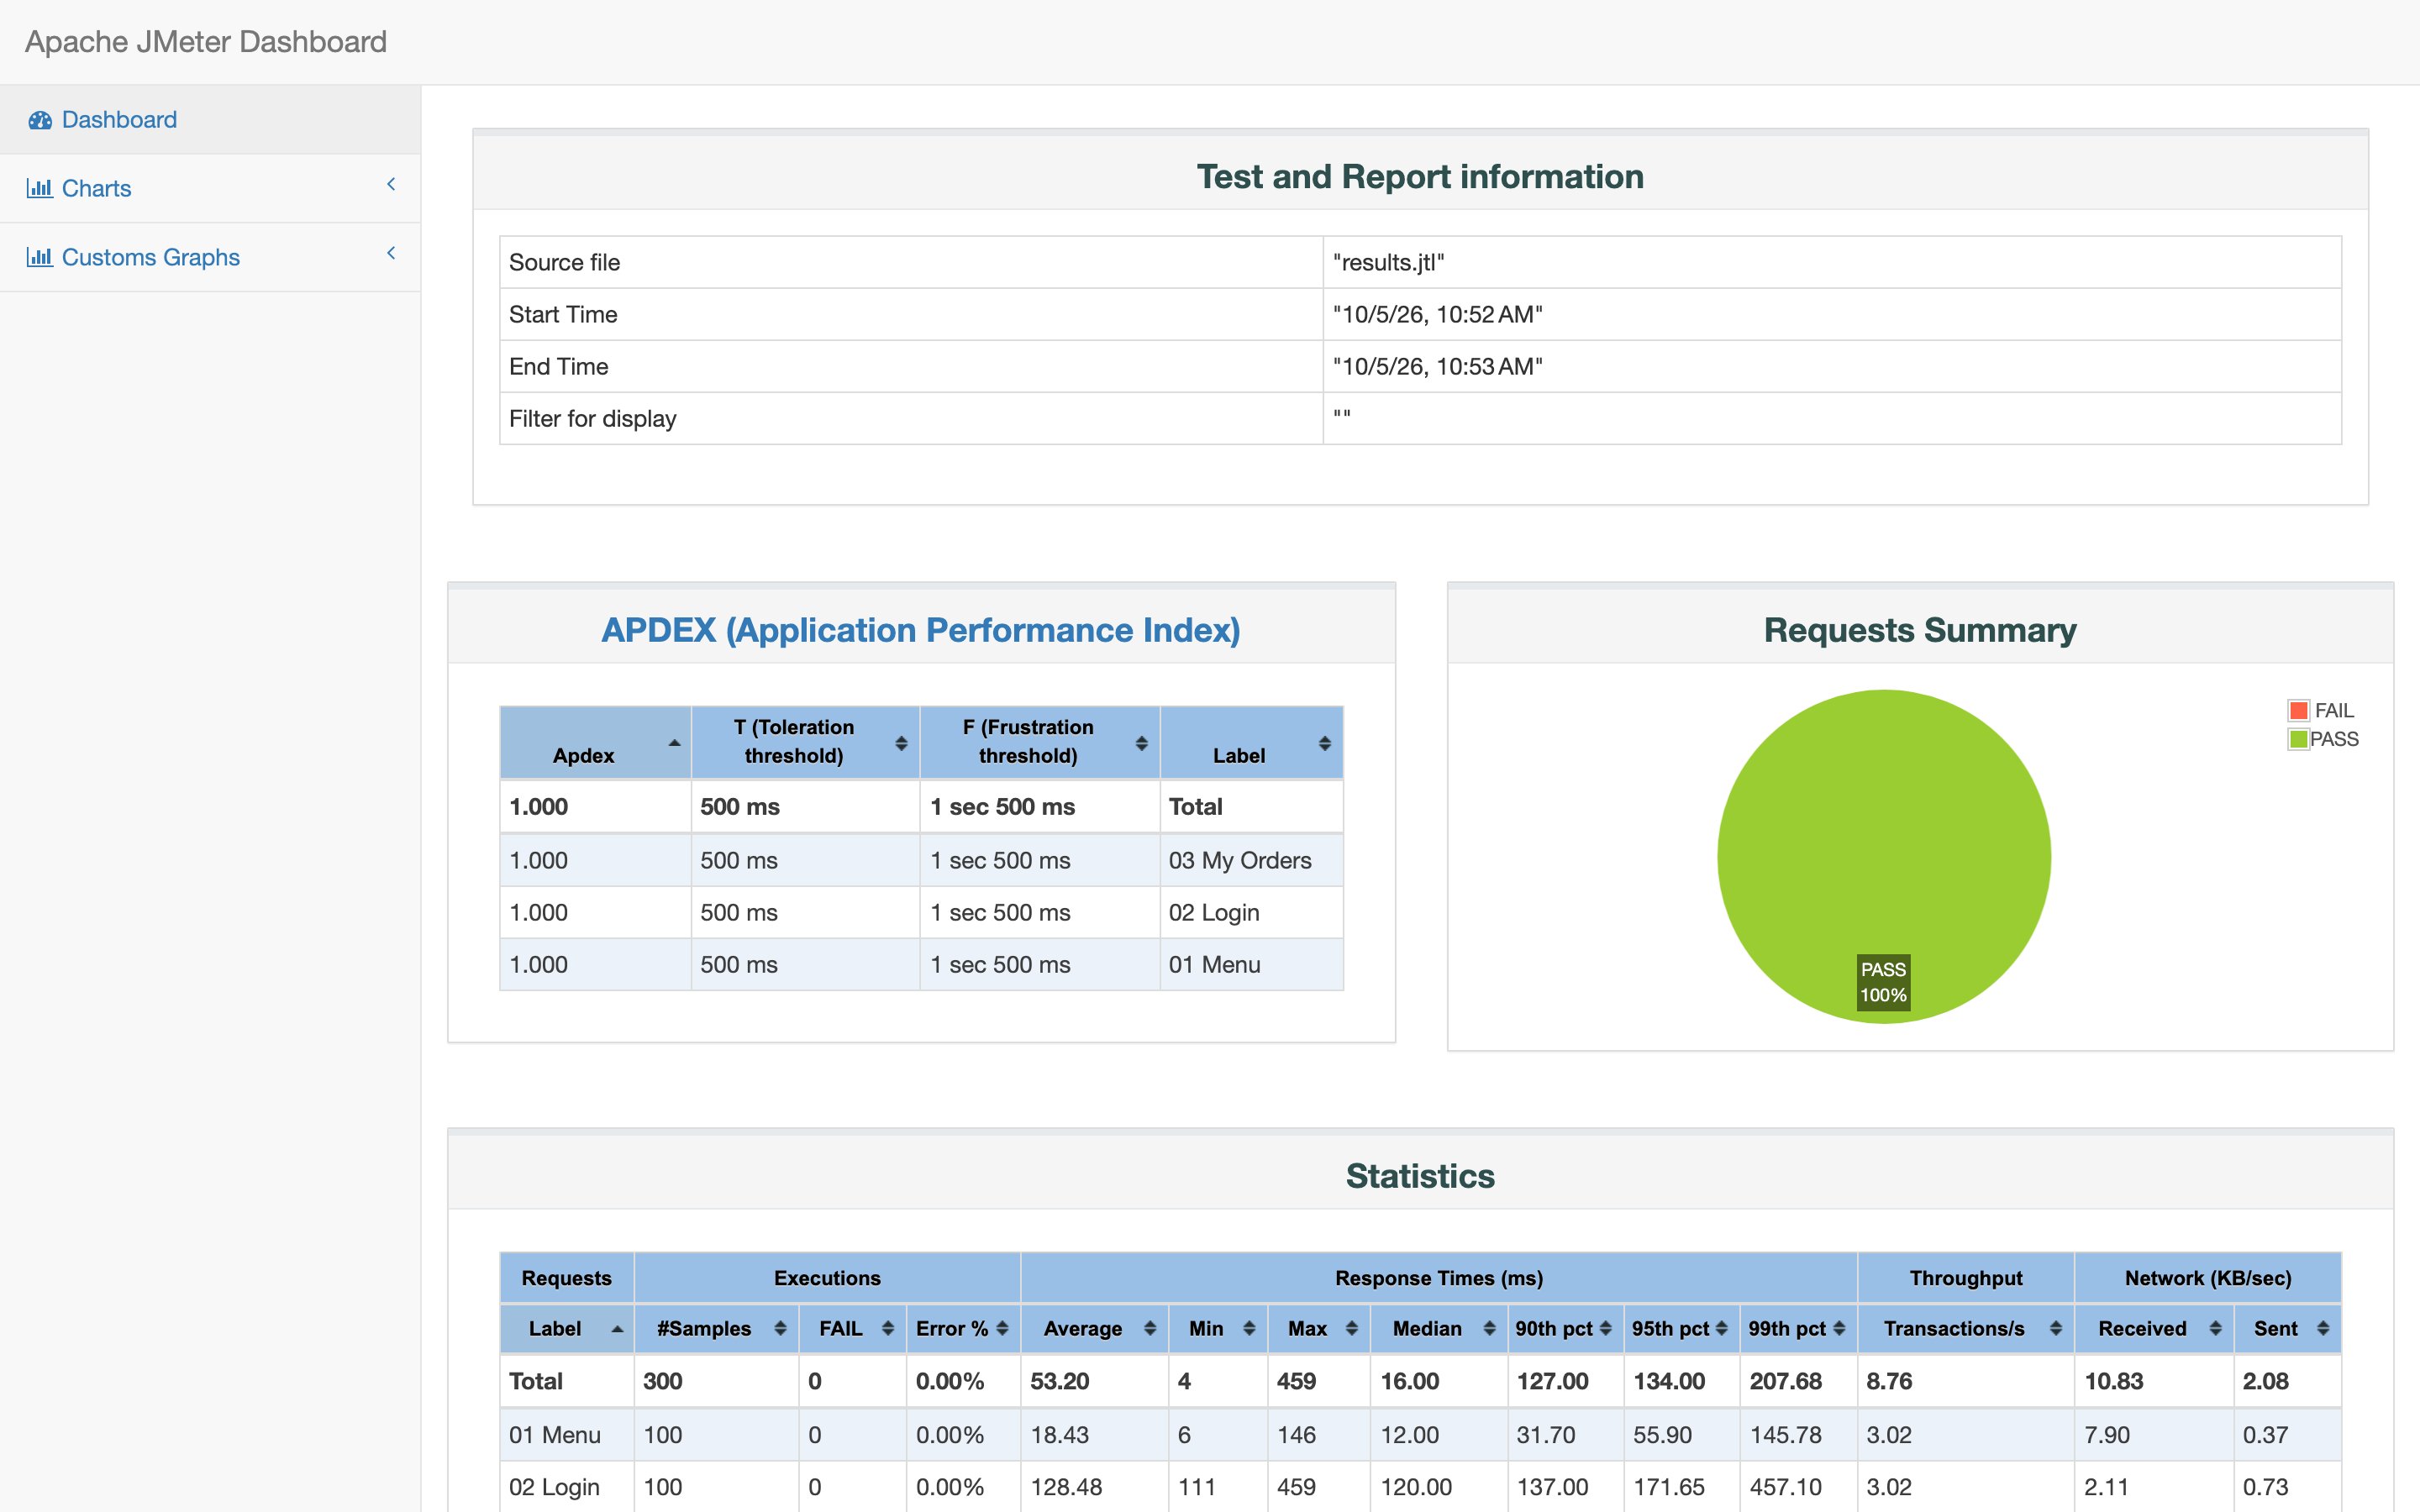
Two LoadLitmus additions are worth knowing:
- Regenerate with a filter. If the report is unreadable because of setup samplers or noisy labels, regenerate it with a label filter. The old report stays in place until the new one succeeds, so a failed regeneration never loses what you had.
- Web report. A standalone HTML page with Chart.js, designed to print to PDF from the browser — the one to send when the client does not want a folder of JMeter output.
Comparing two runs
Select two runs and compare. You get the metrics side by side with the deltas — the honest way to answer "did the fix help?".
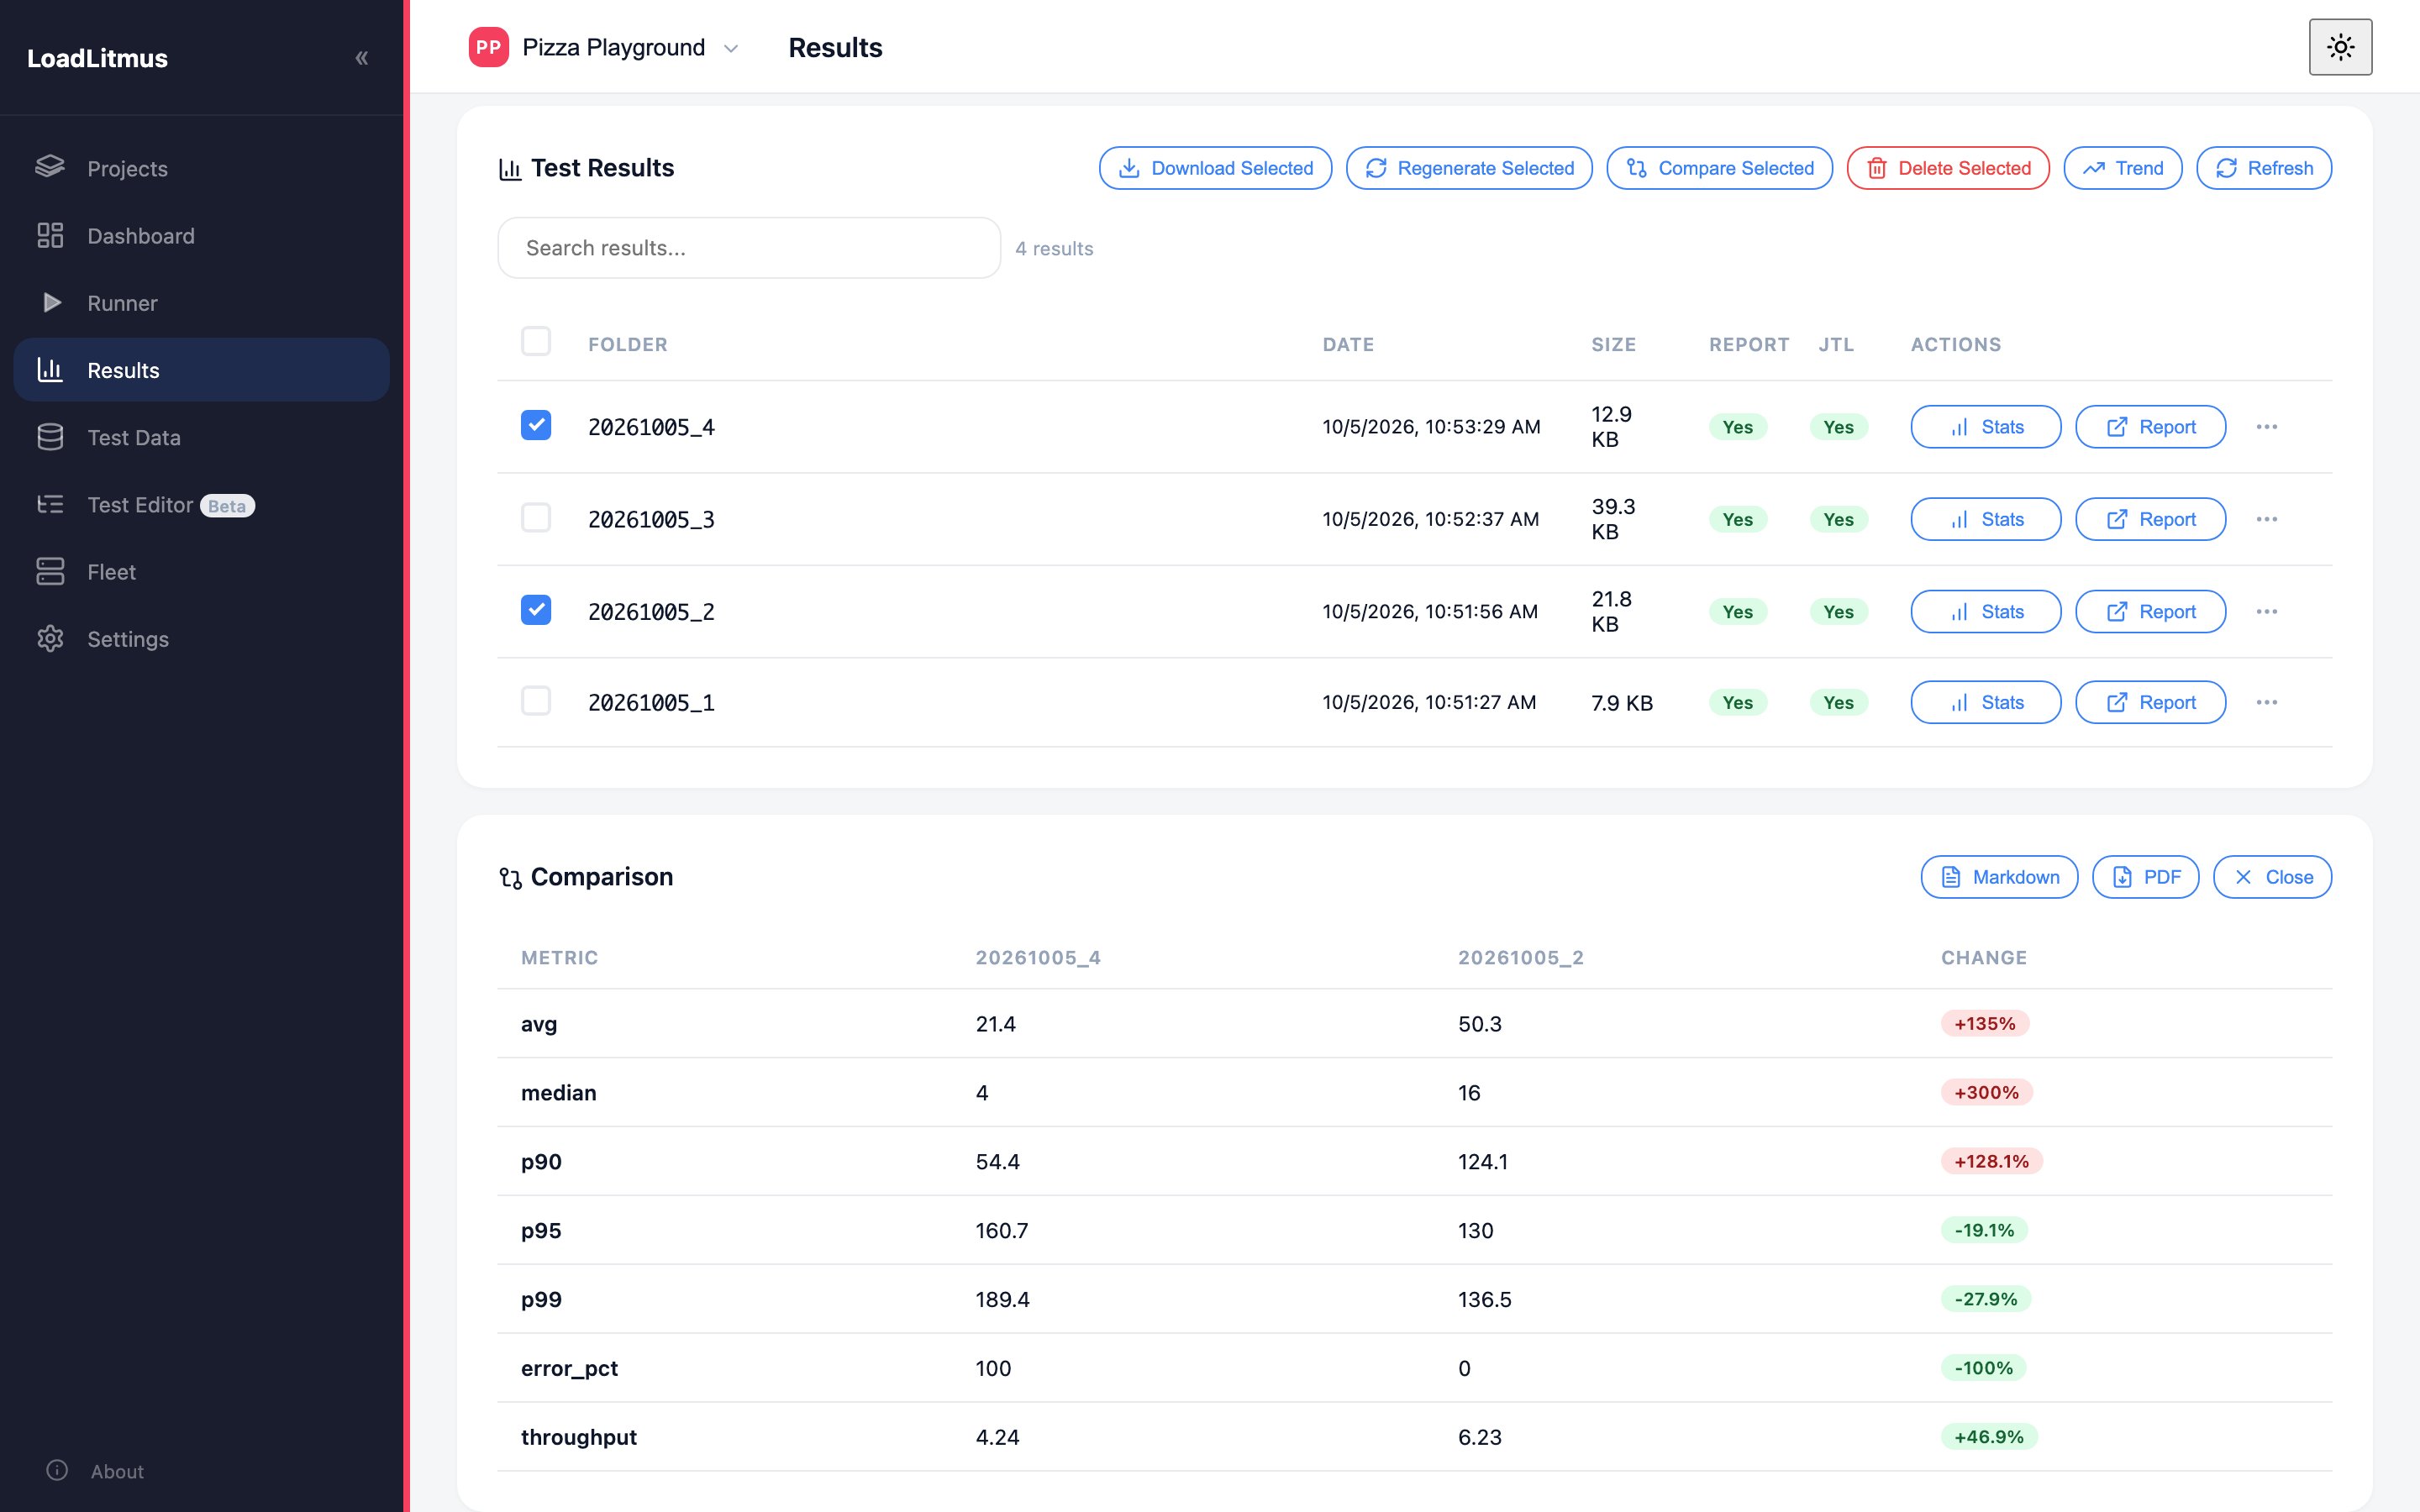
The two runs in the screenshot are not comparable on purpose: one failed every request (error rate 100%), the other passed them all (0%). Throughput and percentiles swing accordingly, which is exactly why you only compare runs of the same shape.
Use it for:
- Before and after a code or infrastructure change.
- The same scenario at two load levels.
- A baseline you keep re-running to catch regressions.
Exports and auto-analysis
- PDF / Markdown export of a run, for the report pack.
- Auto-analysis runs when a test finishes: a rule-based pass over the results that flags the obvious things (error spikes, slow labels, throughput collapse). It is stored with the run as
analysis.json. - If an Ollama server is configured, the analysis is also written up in prose by a local model. It stays on your machine — that is the point of running it on-premise.
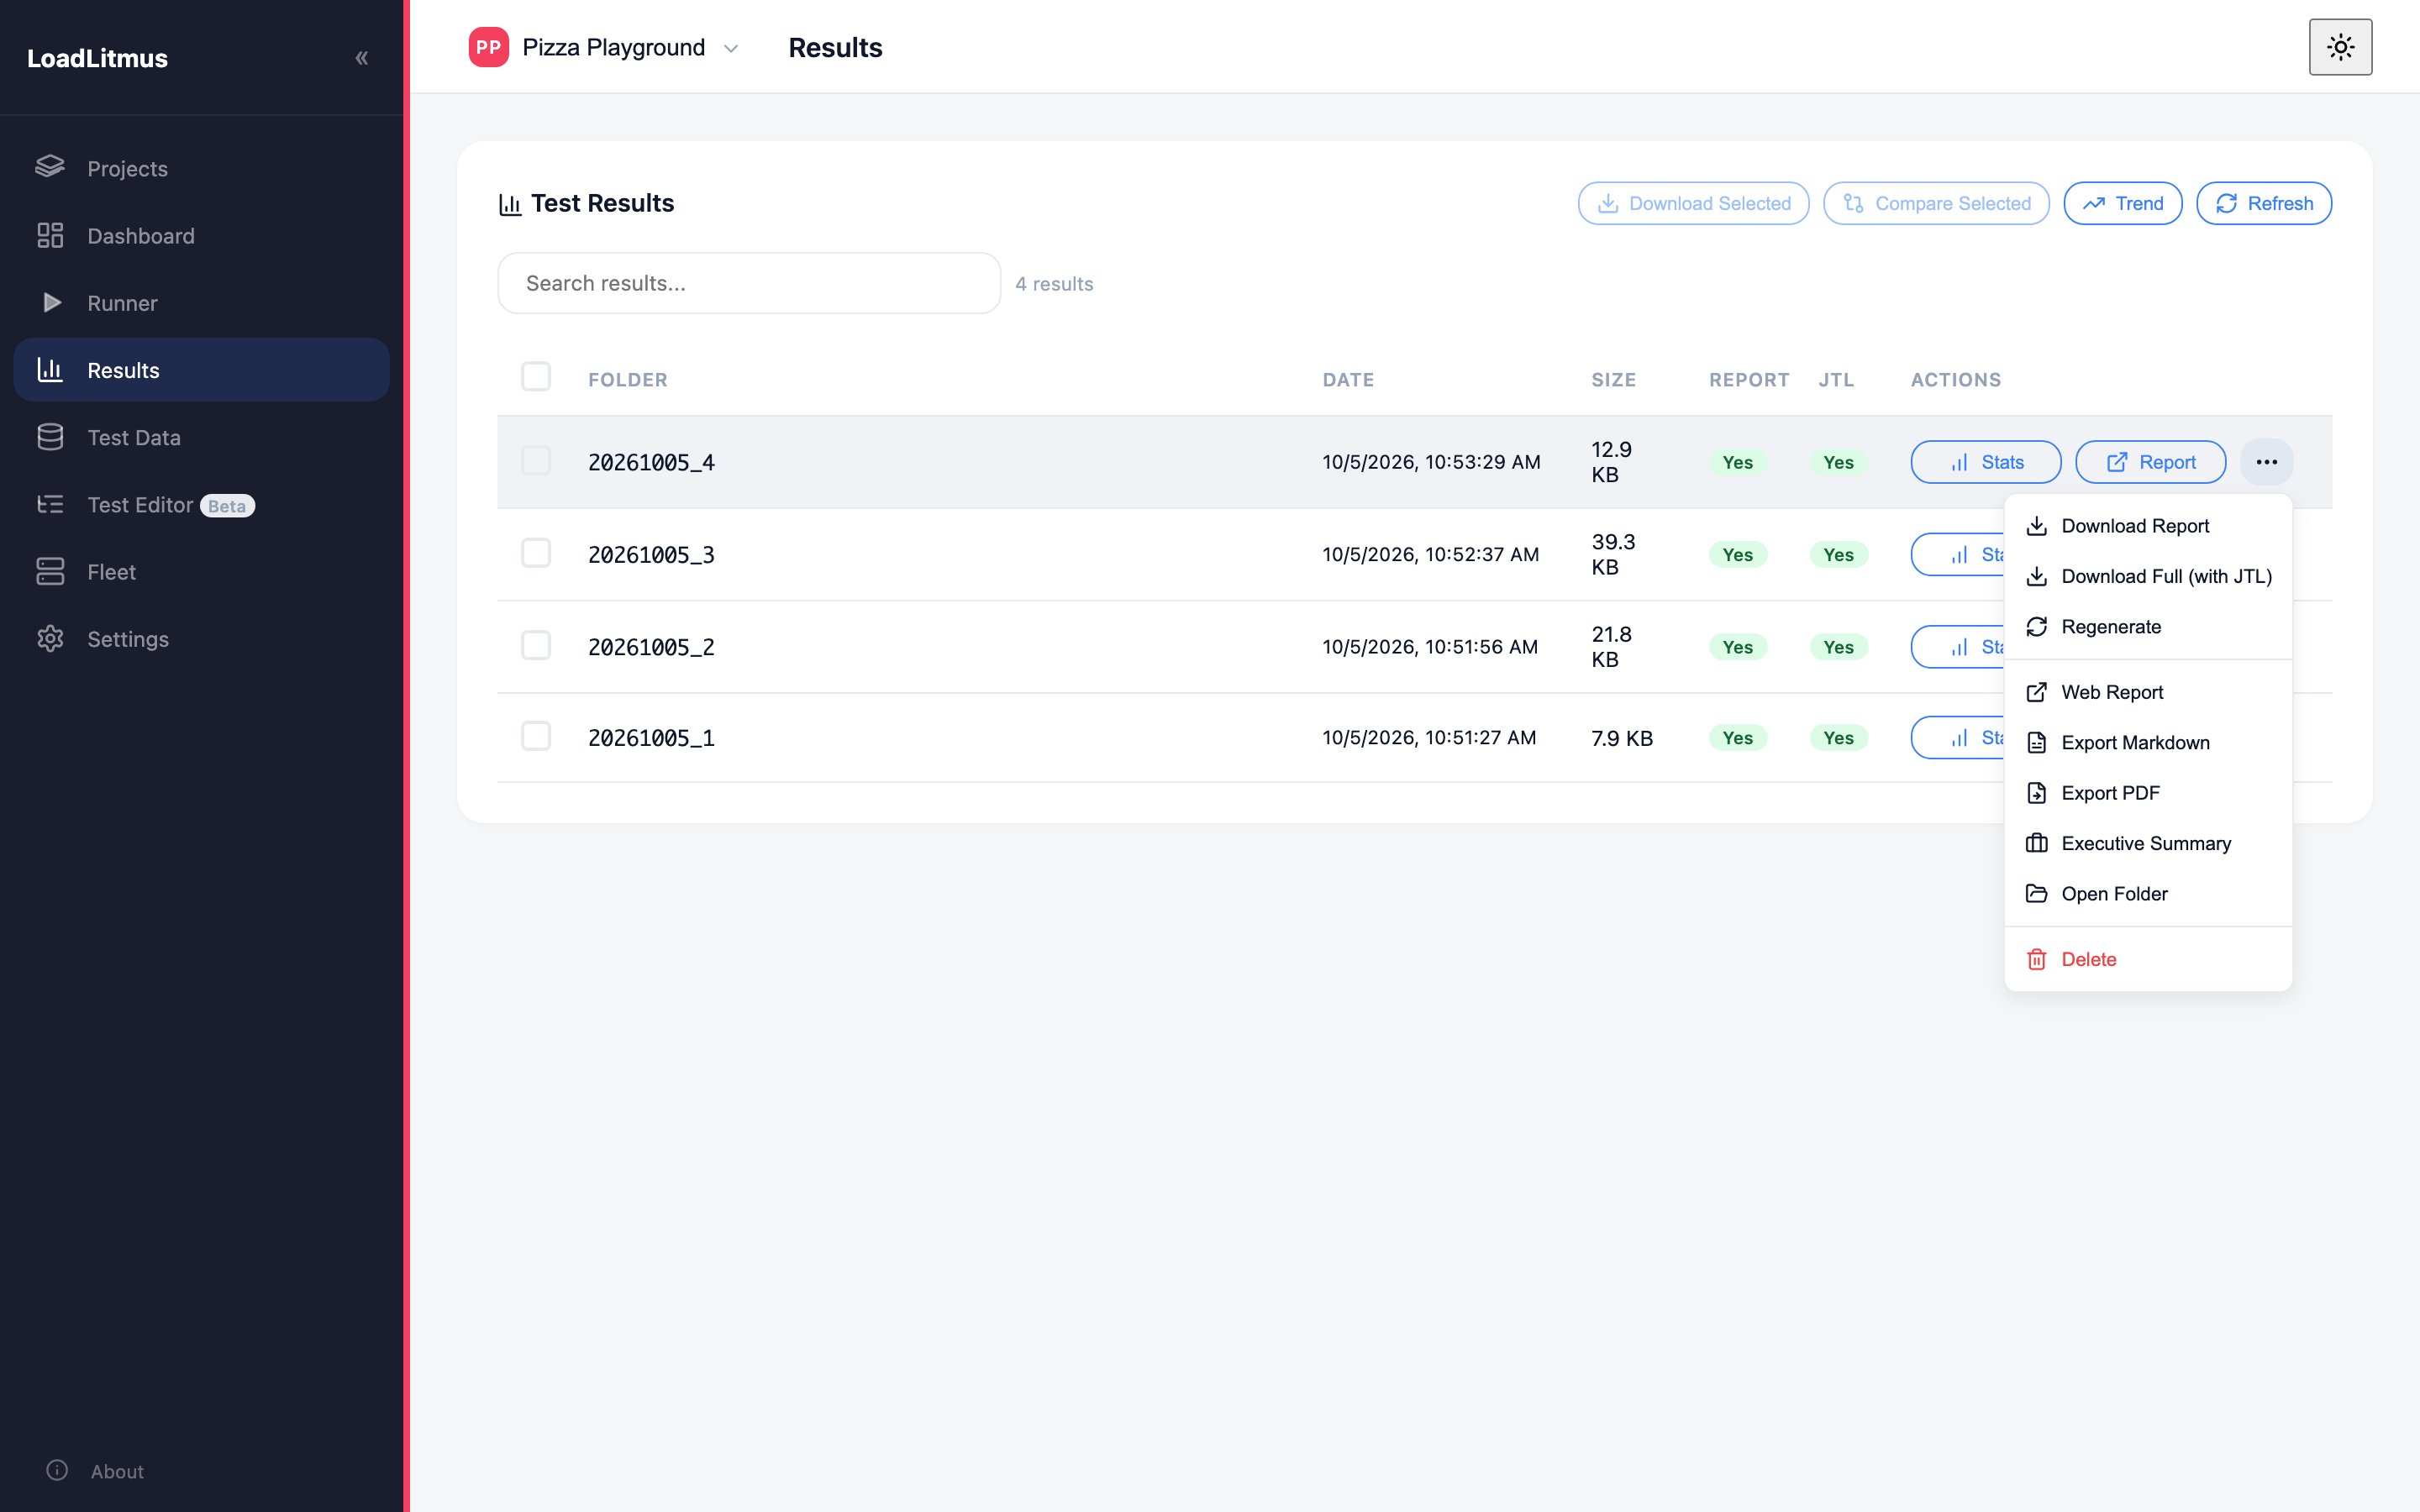
Treat the analysis as a first draft. It sees the numbers, not the system; the "why" is still your job. See Reporting in the JMeter track for how to write the findings up.
Live monitoring
The Monitoring page shows charts during a run instead of after it. It needs InfluxDB:
- App Settings → Integrations: InfluxDB URL, token, organisation.
- Project Settings: the bucket for this project (or leave it on the default).
Monitoring switches itself on once URL, token, org and bucket are all set. From then on, at every launch LoadLitmus patches a copy of your plan with its own Backend Listener, pointing at that InfluxDB, with runId set to the result folder name. Your .jmx on disk is not modified, and you do not need a listener in the script — see Script Requirements.
Because runId always equals the result folder, a run's live charts and its stored result carry the same name. That is what makes "show me the live view of run 20260923_4" a question with an answer.
Not covered here: building Grafana dashboards on top of the same InfluxDB. That is in Backend Listener (InfluxDB + Grafana).
Retention
Results are files, so they grow. The dashboard shows disk usage and warns as the folder gets large.
- Keep the runs that mean something: the baseline, the accepted result, anything you reported.
- Delete the twenty exploratory runs from the day you were fixing the script.
- Archiving a project keeps its results; deleting one moves it to a recycle area first.
Tips
- Screenshot the results list for the report. The run list with its pass and fail figures explains a test campaign faster than a paragraph.
- Export before you hand over. A client who loses access to the machine still has the PDF.
- Compare like with like. Different think times or a different data file make two runs incomparable, however similar the load looks.
- Watch the server while the test runs. The Monitoring module shows how to see the server's CPU, memory and logs beside your results, so a slow run comes with a likely cause.